
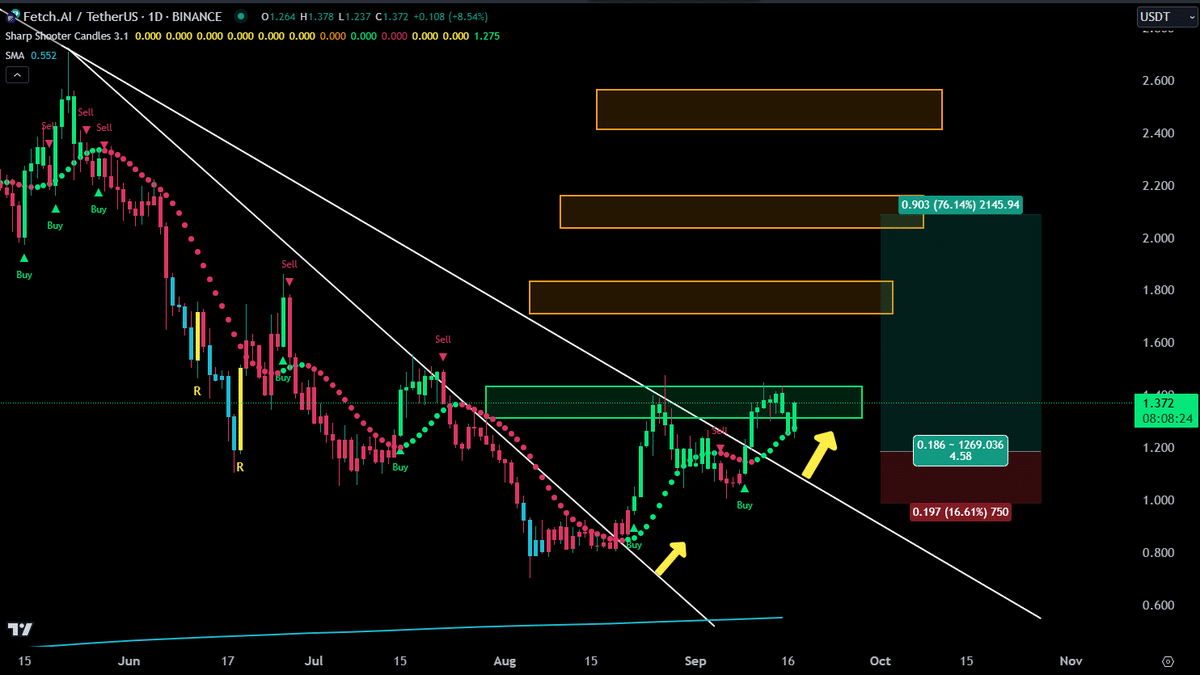
- FET broke through the descending trend line, setting up a potential 76% rally to $2.20 next.
- Bullish indicators showed momentum for FET as traders eyed $1.80, $2.20, and $2.60 targets.
Artificial Superintelligence Alliance [FET] showed strong technical signals at press time, indicating a possible bullish breakout.
The price has broken above a long-term descending trend line, suggesting a potential reversal of the bearish trend.
This move signifies a shift in market sentiment, with growing interest from traders as the coin moves into a more favorable position.
The descending trend line had kept the price suppressed for an extended period, and breaking above it could mark the beginning of an upward trend.
A key level to watch is whether FET can hold above this newly breached trend line, which will determine its next move.
Source: X
The $1.20 — $1.37 zone has acted as a critical support and resistance level for FET. Historically, this zone provided strong resistance, preventing the price from moving higher.
However, recent price action shows that FET is retesting this level as support, suggesting that it could hold as a new base.
Moreover, the risk-reward ratio for traders appeared favorable, with a potential gain of up to 76% if the price reaches the $2.20 target.
Should the price maintain above this zone, it could lead to a test of higher resistance levels, potentially targeting $1.80, $2.20, and $2.60.
If FET can stay above this support level, it will likely be crucial for future price movements as the market anticipates further gains.
Bullish momentum for FET
Several bullish indicators, including buy signals and the Parabolic SAR, supported the positive outlook for FET. The Parabolic SAR, with its dots positioned below the price, indicated growing buying pressure.
Momentum is building, and traders are watching for additional signs of a strong upward move.
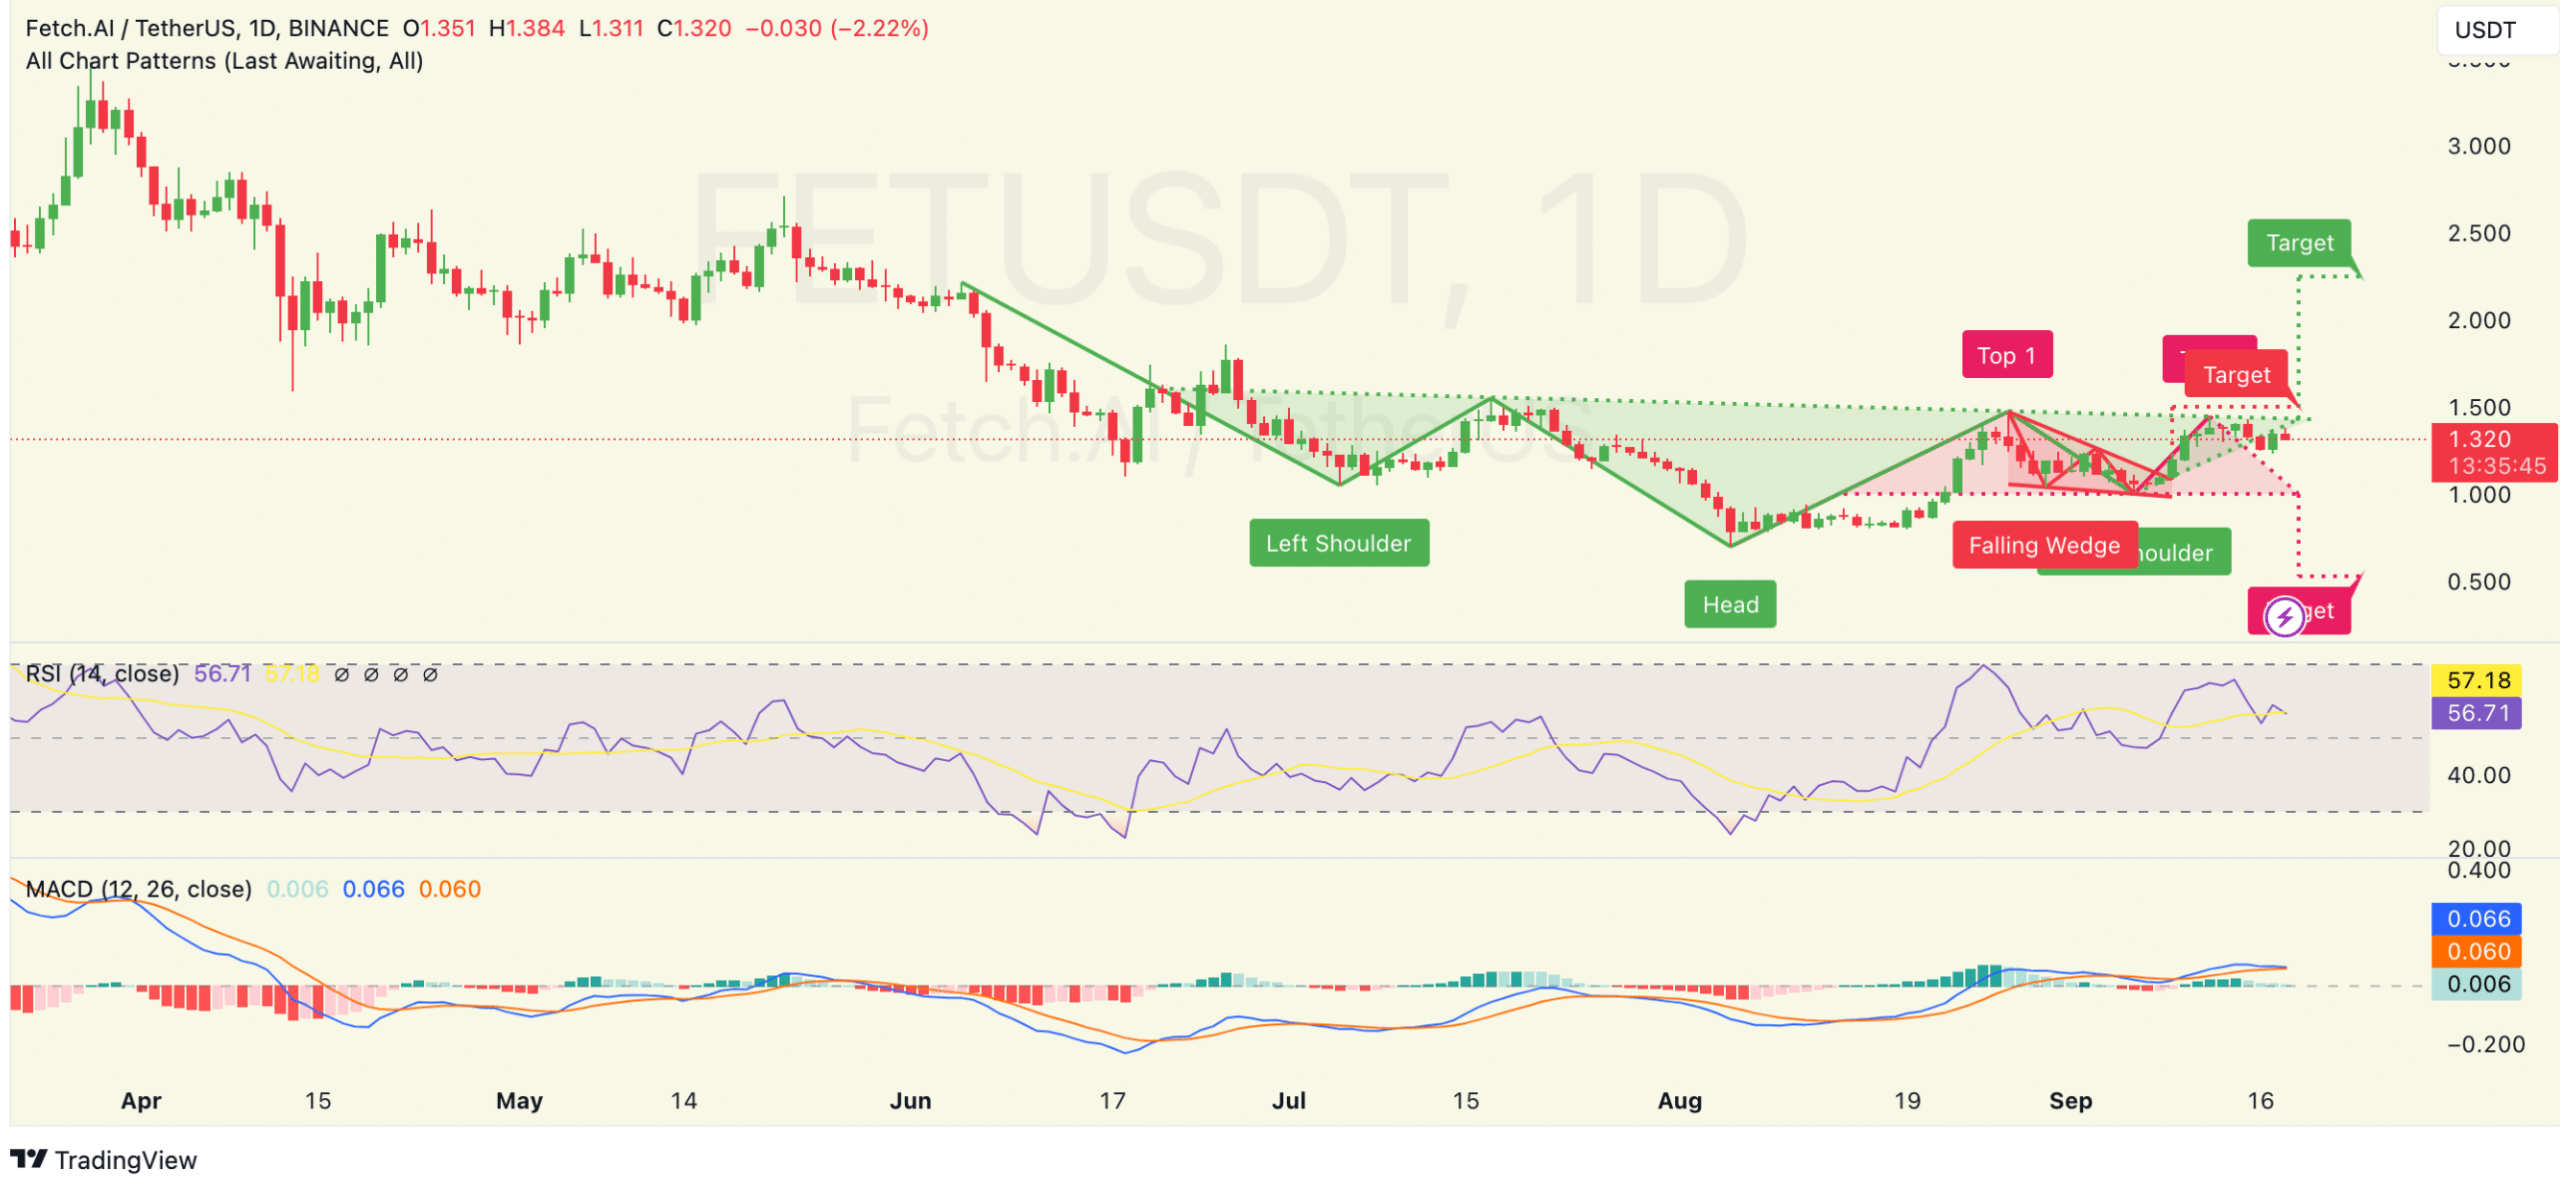
Source: TradingView
Other technical indicators, like the RSI and MACD, also suggested bullish momentum. The RSI stood at 57, showing that there was room for more upside before overbought conditions occur.
The MACD line crossing above the signal line further signaled a strengthening bullish trend, indicating that FET could continue to rise in the short term.
Volume and network activity
On-chain data from IntoTheBlock revealed a mixed picture for FET. As of the 17th of September, there were 1.73k total addresses, including 418 new addresses and 1.06k active addresses.
However, the number of new addresses has decreased by 5.64% over the last week, while active addresses have dropped by 15.58%.
Additionally, zero-balance addresses decreased by 24.02%, possibly indicating outflows or inactive wallets.
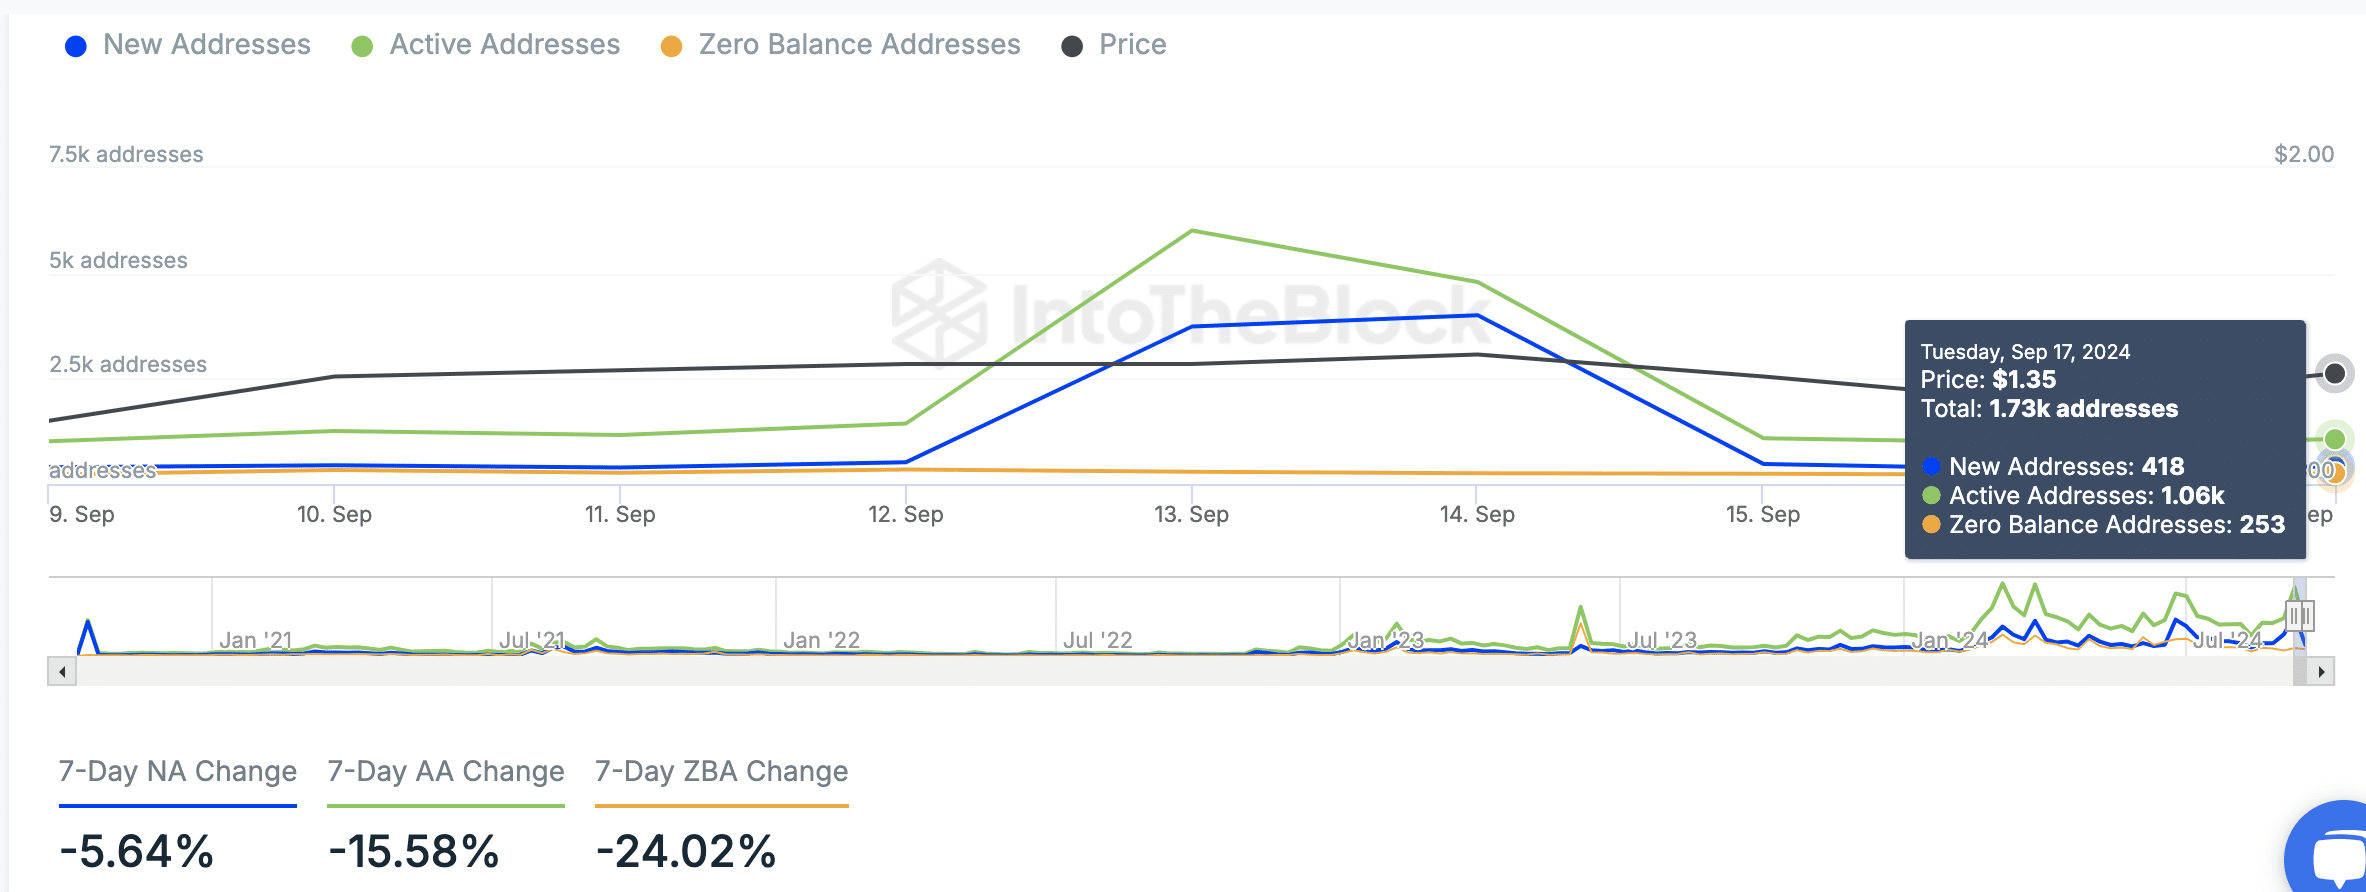
Source: IntoTheBlock
Transaction volume has also fluctuated in recent days. Volume peaked at 147.28 million FET on the 13th of September but dropped to 20.75 million FET by the 17th of September.
Despite this decline, the 7-day average remained at 52.84 million FET, showing that market activity was still robust.
This recent drop in volume may indicate reduced short-term interest or profit-taking by traders following the earlier price surge.
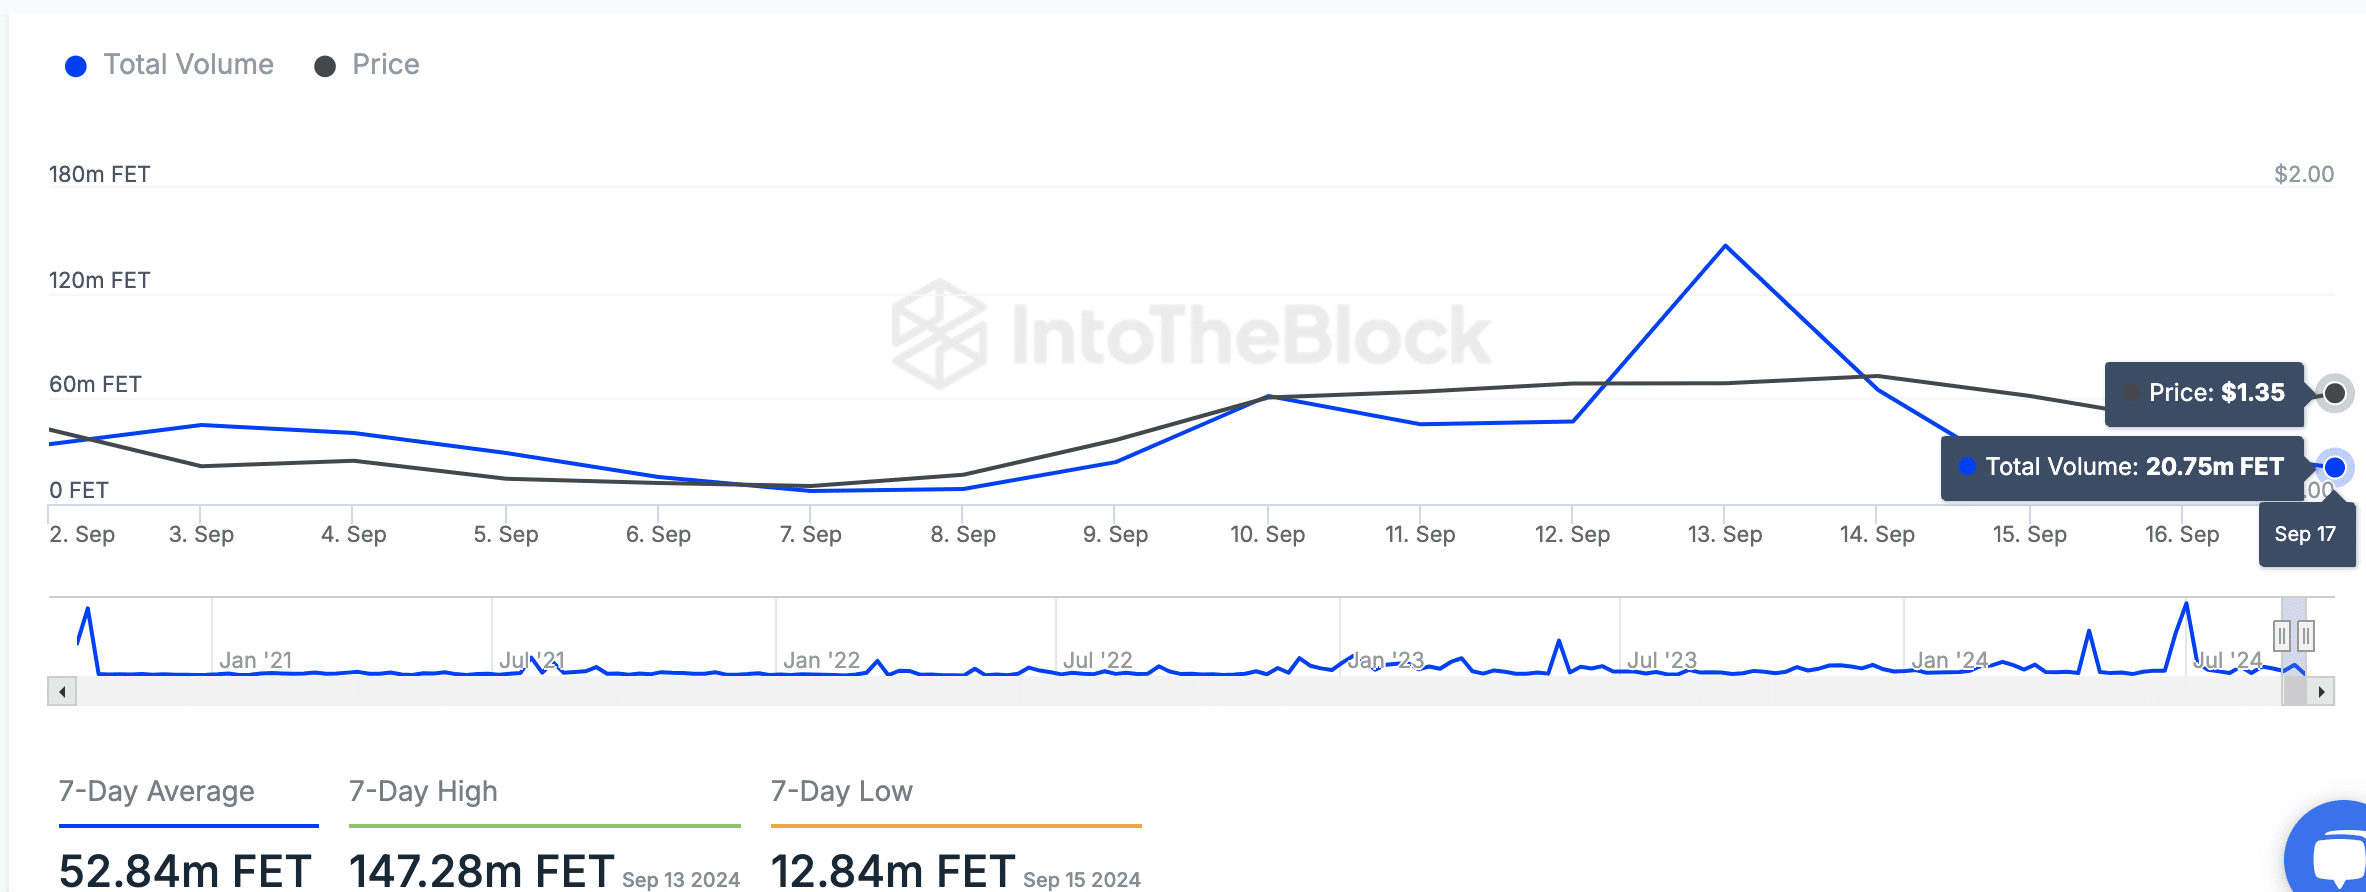
Source: IntoTheBlock
According to Coinglass data, FET experienced a 20.56% increase in trading volume, reaching $229.41M.
Read Artificial Superintelligence Alliance’s [FET] Price Prediction 2024–2025
Meanwhile, Open Interest declined by 9.05% to $62.43M, suggesting a shift in market positioning.
While volume remains elevated, the decrease in Open Interest may imply some caution among traders, but overall market activity remained strong.