[ad_1]
- Arbitrum’s DeFi TVL has increased steadily and recently reached a one-month high of $2.45 billion.
- Despite a rise in TVL and open interest, bearish signals around ARB continue to dampen the market sentiment.
Arbitrum [ARB] has been stuck in a bearish trend, as its price has dropped by 11% in the last month. However, the downtrend is showing signs of weakness as in just four days, ARB has bounced from $0.49 to $0.56.
ARB had lost some of these gains at press time and traded at $0.551. On-chain data suggests that ARB is well-positioned to make a rebound and possibly reclaim its monthly highs.
Rising DeFi TVL could fuel ARB rally
Arbitrum was recently flipped by Base in terms of Total Value Locked (TVL) and currently ranks as the second-largest layer 2 network by this metric.
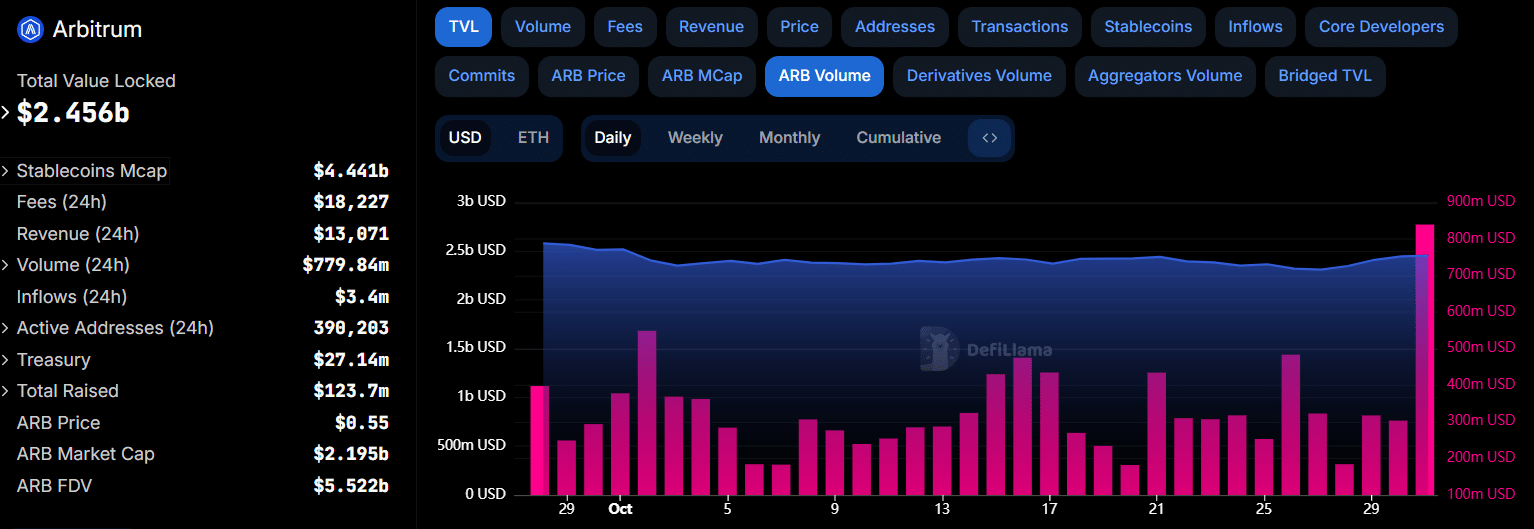
Data from DeFiLlama shows that decentralized finance (DeFi) activity on the network is rising again. At press time, Arbitrum’s DeFi TVL stood at $2.456 billion, its highest level in one month.


Source: DeFiLlama
Besides the rising TVL, ARB volumes on centralized and decentralized exchanges have soared to the highest level since August.
The rising TVL and spike in volumes point towards growing interest in the DeFi applications created on the layer 2 network. This could in turn support ARB’s price recovery.
Arbitrum’s open interest surges
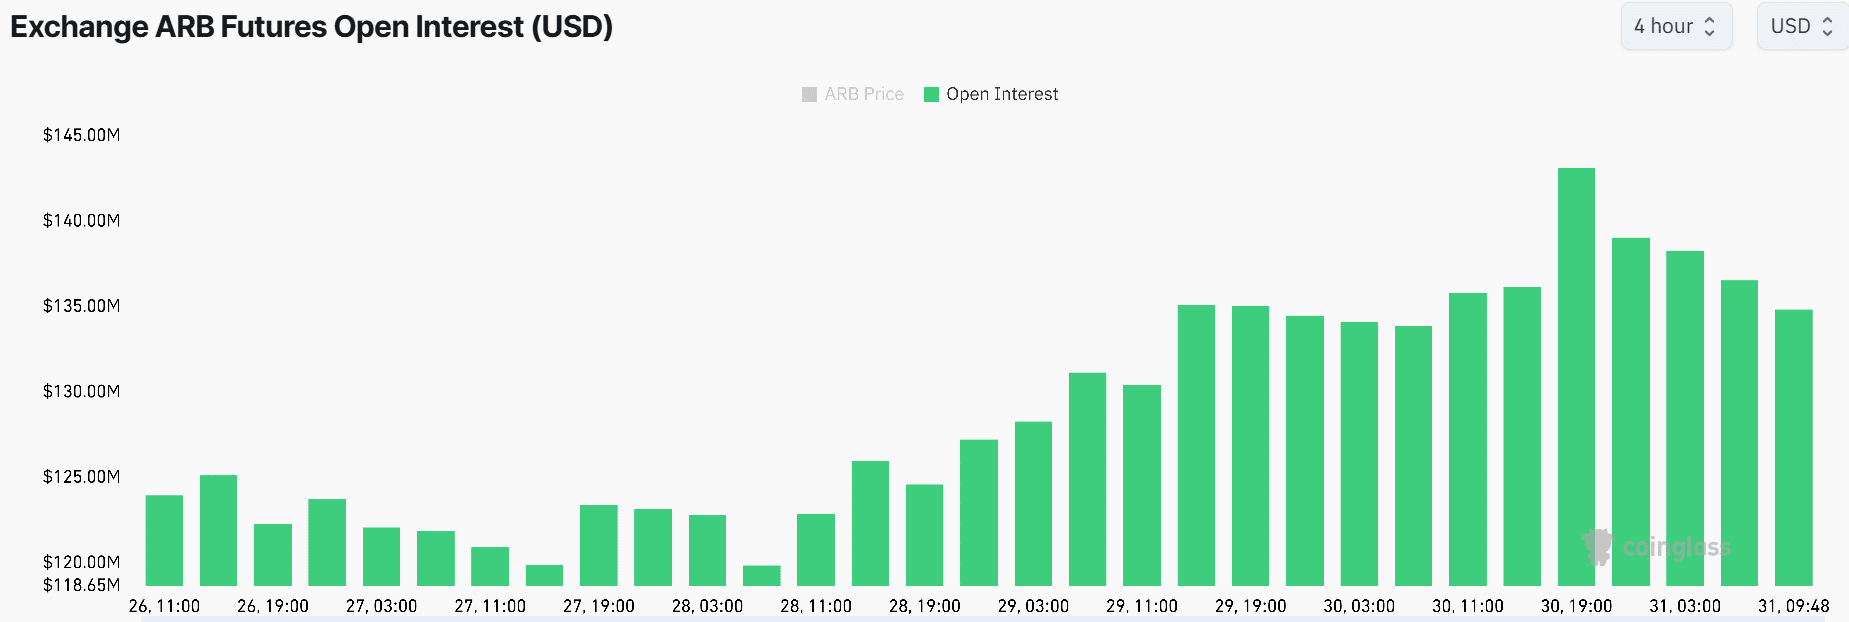
There is also a surge in speculative activity surrounding Arbitrum. This is seen in the surge in open interest that stood at $135 million at press time.
In just three days, ARB’s OI has increased by more than 10% suggesting that derivative traders are opening new positions on the token.


Source: Coinglass
A spike in OI that accompanies a price increase usually portrays bullish sentiment. Moreover, Arbitrum’s funding rates have been predominantly positive since September reinforcing the bullish thesis.
Is ARB poised for a breakout?
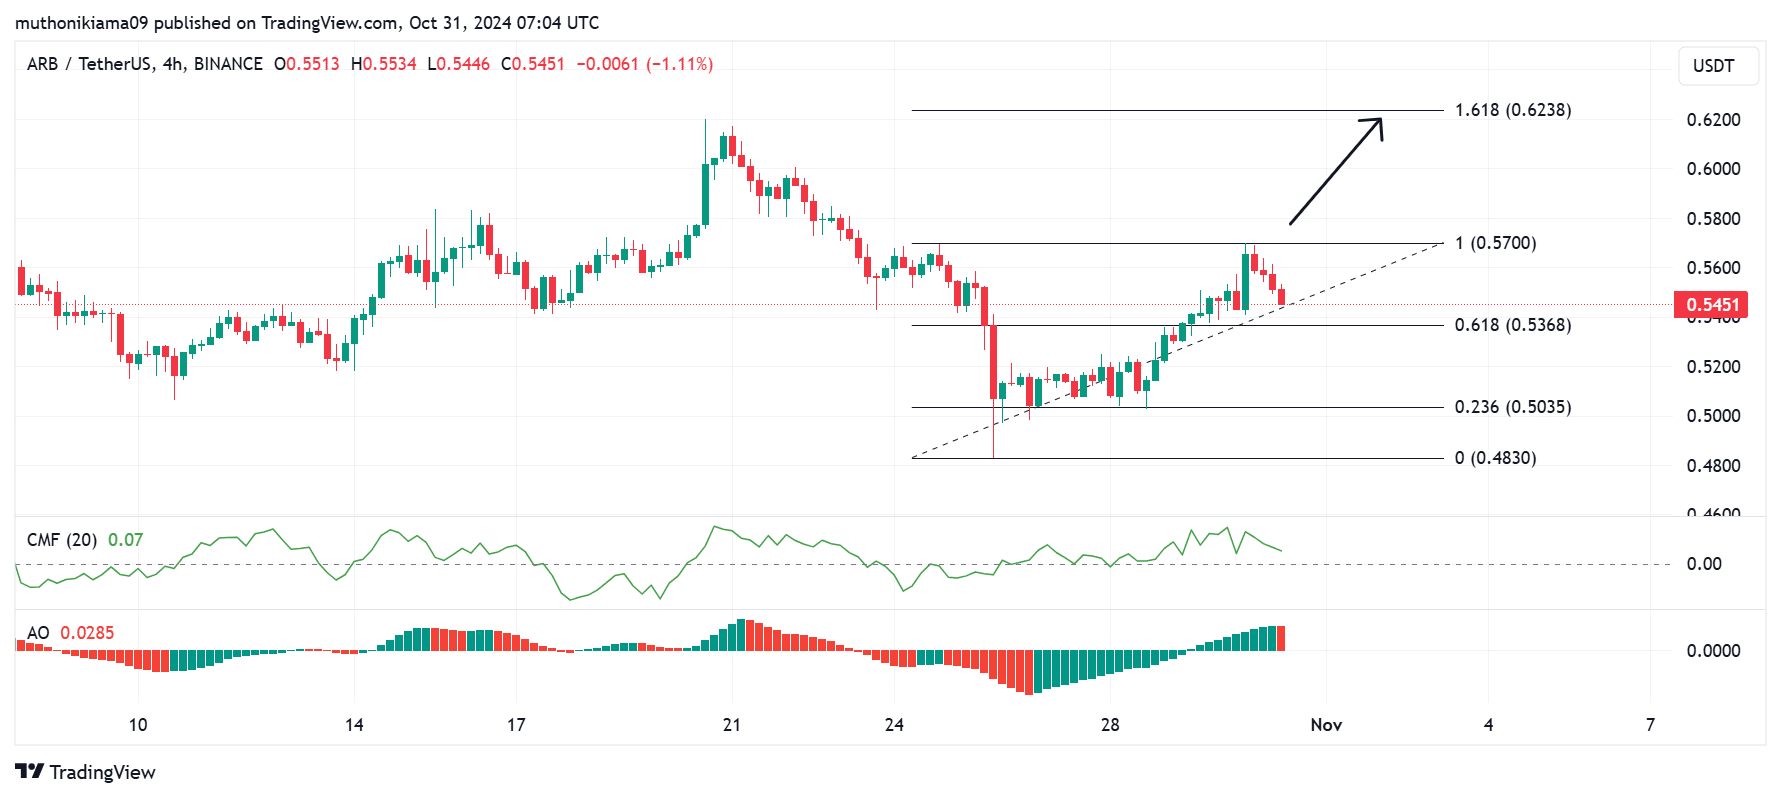
Arbitrum’s four-hour chart shows that the short-term momentum has flipped bullish. The Chaikin Money Flow (CMF) indicator has a positive value of 0.07, pointing towards higher buying pressure than selling pressure.
The Awesome Oscillator also shows that bulls are taking control of ARB’s price action, with the AO bars flipping positive.
However, the movement of these indicators also calls for caution. The CMF is tipping south suggesting that the buying pressure is waning. Additionally, the red AO bar shows that bears are battling for control.


Source: Tradingview
If new buyers enter at current prices and Arbitrum breaks resistance at $0.57, the next target will be the 1.618 Fibonacci level ($0.62).
Realistic or not, here’s ARB’s market cap in BTC’s terms
On the other hand, if ARB succumbs to the bearish trends, and drops below support at the 0.618 Fib level ($0.53), the price could plunge to collect liquidity at $0.48.
The Arbitrum long/short ratio suggests that traders are heavily leaning towards another drop. This ratio has dropped to 0.75, with 57% of traders opening short positions. This suggests traders are less optimistic that the bullish signs around ARB will continue.


Source: Coinglass
[ad_2]
Source link

