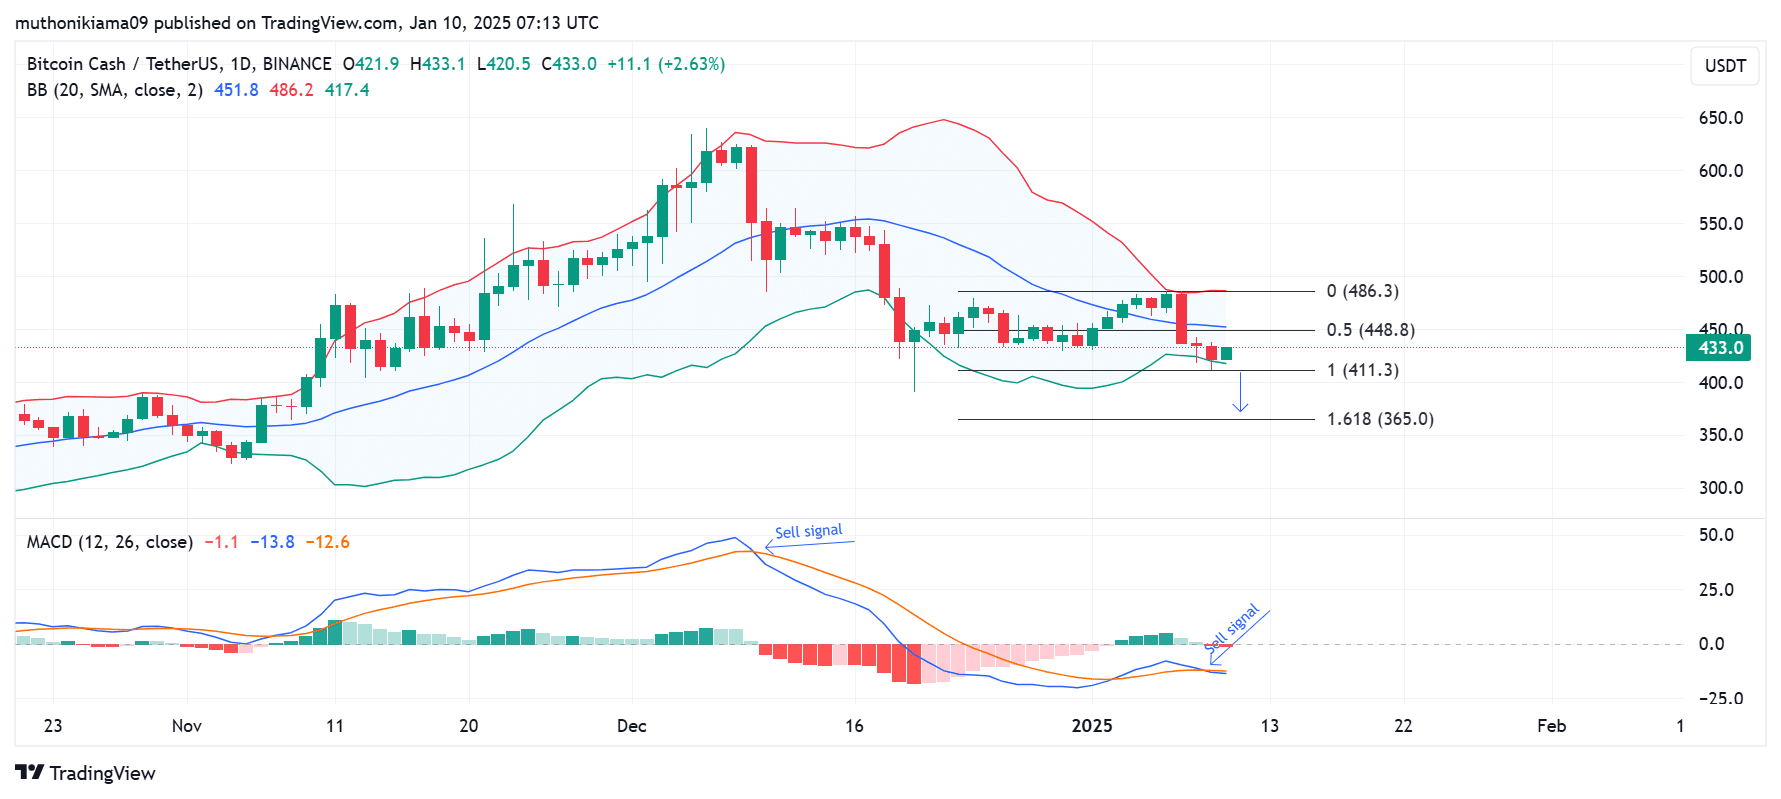
- Bitcoin Cash has formed a sell signal on its MACD indicator, which could cause a price decline to $365.
- Despite the bearish trends, traders on Binance are betting on further price increases.
Bitcoin Cash [BCH] had gained slightly by 0.1% to trade at $430, at press time. Despite this gain, the altcoin was down by 6.5% in the last seven days, reflecting a bearish trend across the broader cryptocurrency market.
On the charts, bears remained in control of BCH’s price action, as shown by the Moving Average Convergence Divergence (MACD) indicator. The histogram bars and the MACD line were negative, indicating bearish momentum.
The crossover of the MACD line below the signal line has also formed another sell signal. Historically, this sell signal has triggered a steep decline for BCH.

Source: TradingView
A strong support level for Bitcoin Cash lies at the lower Bollinger band at $417. If the altcoin breaches this support, it could cause a decline to the 1.618 Fibonacci level at $365.
Key resistance level to watch
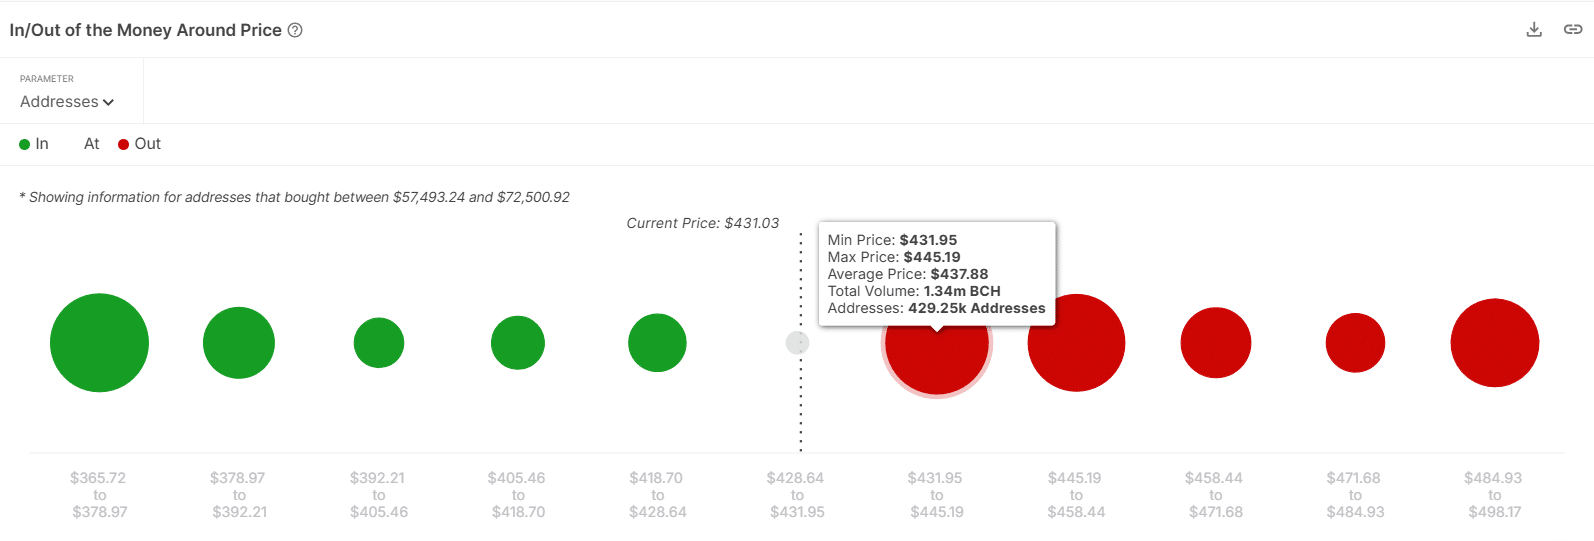
The In/Out of the Money Around Price (IOMAP) indicator shows a crucial resistance level for BCH between $432 and $445.
Over 429,000 addresses purchased the token at these price levels, and if they choose to minimize their losses, it could increase sell-side pressure.


Source: IntoTheBlock
Given the intensity of losses at this supply zone, buyers could view it as an unfavorable entry point, hindering any potential uptrend.
Traders increase bullish bets
Traders on Binance are bullish on Bitcoin Cash, despite the negative outlook on the one-day chart. The percentage of traders that have taken long positions on BCH has increased to 71%, while short traders are 28%.


Source: Coinglass
The high number of traders with long positions suggests a consensus that BCH could secure gains. However, these positions could be subject to liquidations if there is another price drop, adding to the selling pressure.
One factor driving the demand for long positions is a drop in funding rates to 0.0076% per Coinglass. This indicates that traders are paying less to maintain their open positions.
Read Bitcoin Cash’s [BCH] Price Prediction 2024–2025
Bitcoin Cash’s one-day chart shows prevalent bearish trends. Moreover, a sell signal on the MACD could exert more downward pressure on the price, causing the token to decline further.
The bullish bias seen on the Long/Short Ratio points toward positive market sentiment. However, this might not bode well for the price, if a drop causes forced long liquidations, resulting in selling activity.

