- Bitcoin might currently be at its market bottom.
- In case of a bullish breakout, BTC must first target $61.3k before it aims for $63.2k.
After a week of high volatility in the bears’ favor, Bitcoin’s [BTC] price started to somewhat consolidate. This gave the notion that the bearish trend might come to an end.
But there was more to the story, as a key metric hinted at a continued price decline in the coming days.
Bitcoin still has troubles
CoinMarketCap’s data revealed that the bears dominated the market last week, as the king coin’s price declined by more than 10%. The last 24 hours were better, as the coin’s price only dropped by over 1.7%.
At the time of writing, BTC was trading at $57,523.15 with a market capitalization of over $1.14 trillion.
Meanwhile, Ali, a popular crypto analyst, posted a tweet revealing more troubles for the king coin. The analysis used BTC’s Short-Term Holder Realized Price, which helps gauge the behavior of recent Bitcoin buyers.
Notably, since the 22nd of June, BTC has struggled to break above this level, and the Short-Term Holder Realized Price reached $63,250. Therefore, it’s crucial for BTC to reclaim this level.
Until then, BTC continues to face the danger of selling pressure, which might push the coin’s price down further.


Source: X
Will BTC cross $63k soon?
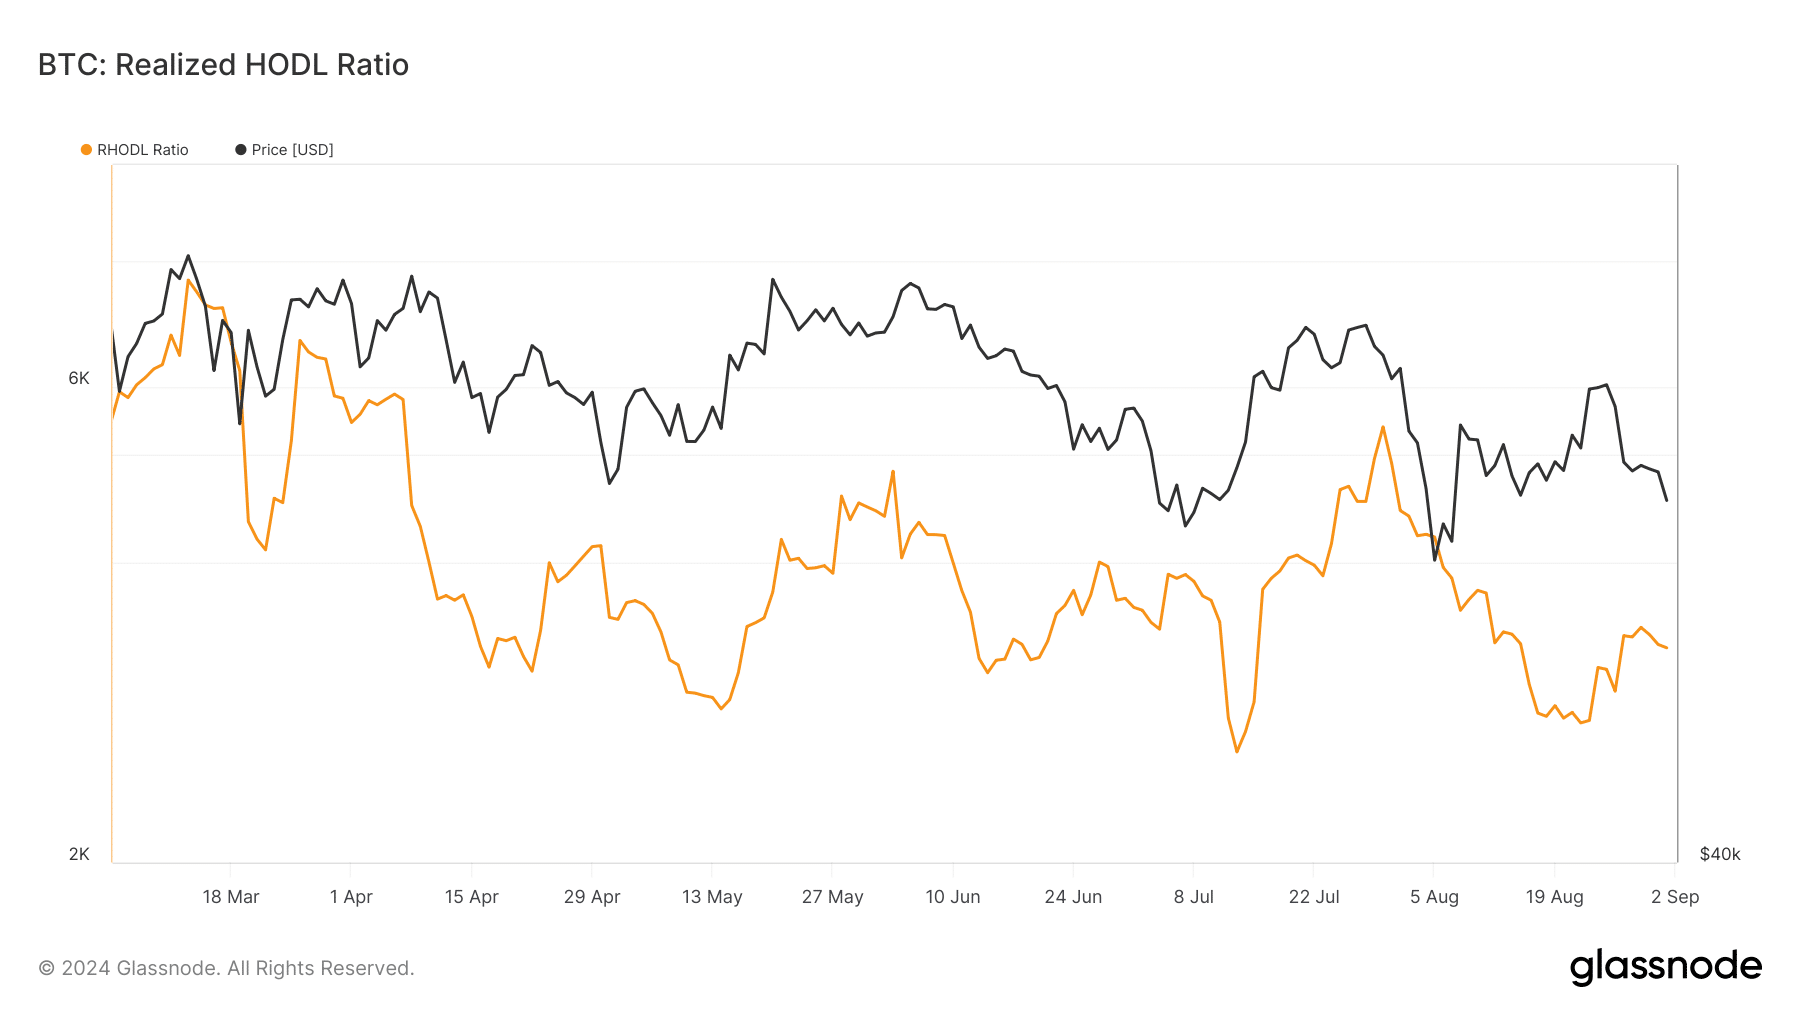
Since the danger of a price drop loomed around BTC, AMBCrypto planned to check its metrics to find the odds of BTC reclaiming $63.2k. Our analysis of Glassnode’s data revealed Bitcoin’s realized HODL ratio.
For starters, the RHODL Ratio takes the ratio between the 1 week and the 1-2 year RCap HODL bands. At press time, it registered a downtick, which could possibly indicate a market bottom.


Source: Glassnode
Apart from this, a few other metrics also looked optimistic. Our analysis of CryptoQuant’s data pointed out that BTC’s aSORP was green, meaning that more investors were selling at a loss.
In the middle of a bear market, it can indicate a market bottom.
The Binary CDD was also green, suggesting that long-term holders’ movement in the last seven days was lower than average. So, they have a motive to hold their coins.


Source: CryptoQuant
We then checked Bitcoin’s daily chart to see whether technical indicators hinted at a price rise towards $63.2k.
Read Bitcoin’s [BTC] Price Prediction 2024-25
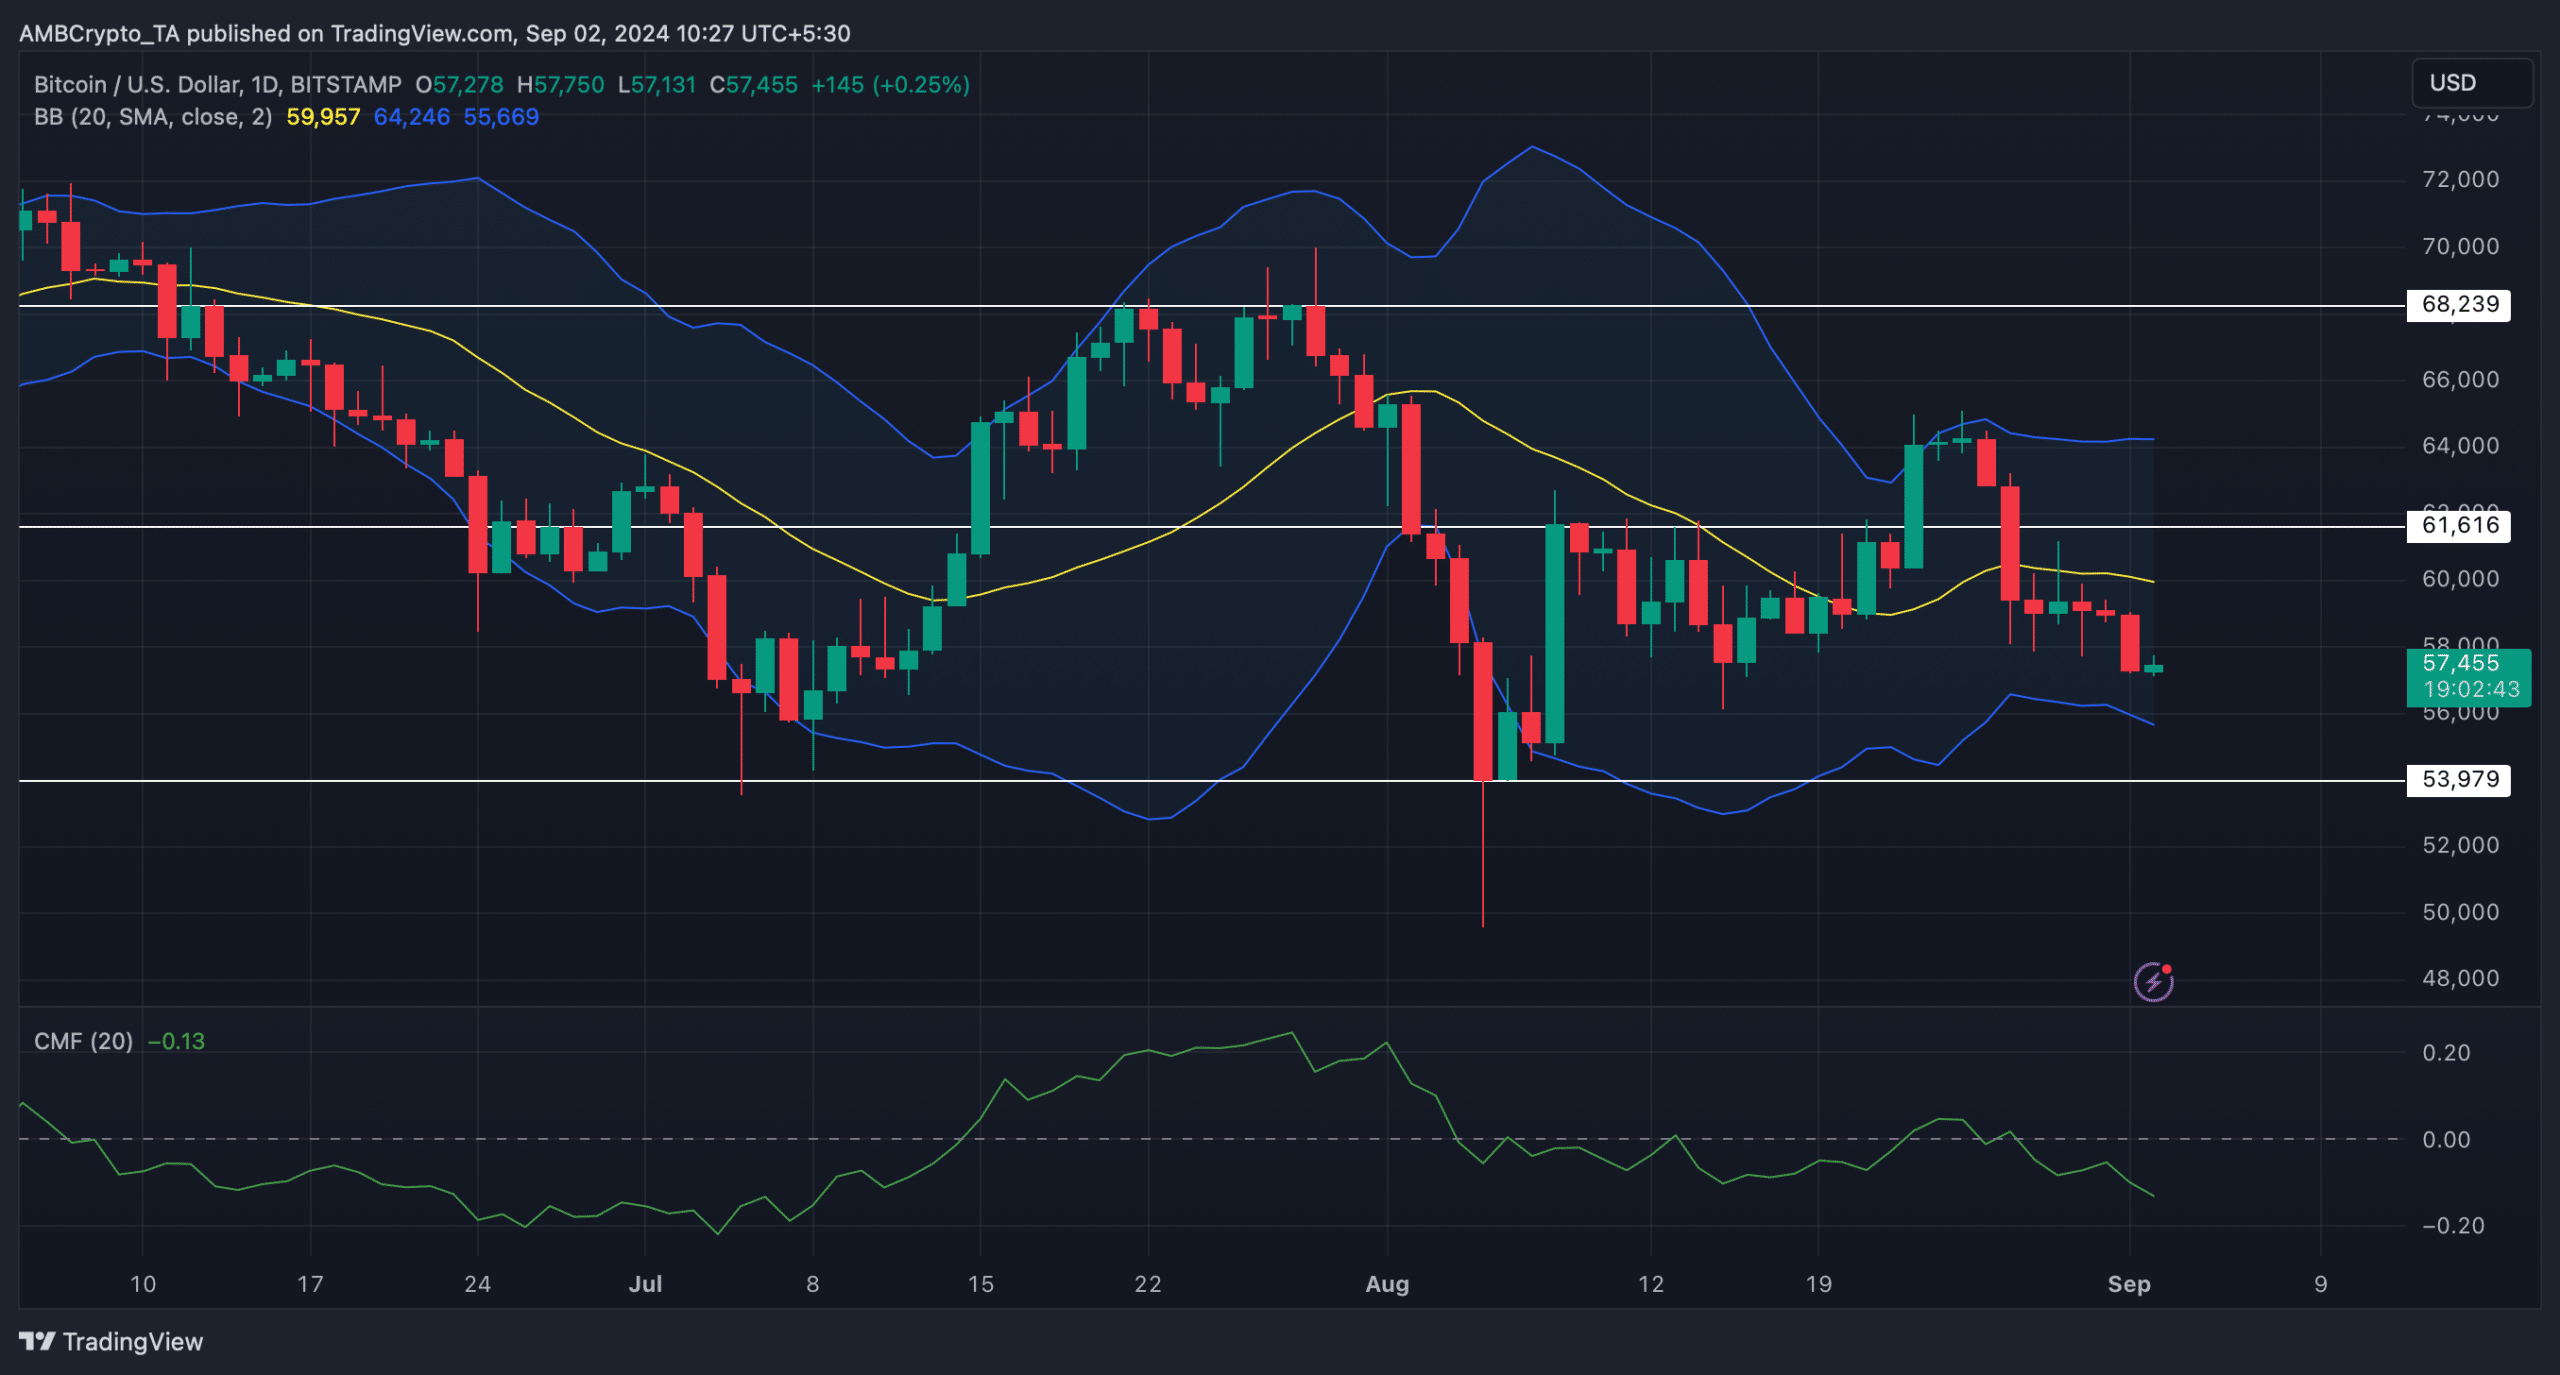
Bitcoin’s price was about to touch the lower limit of the Bollinger Bands, which often results in price rebounds. If that happens, then it would be crucial for BTC to go above $61.6 before it eyes $63.2k.
Nonetheless, the Chaikin Money Flow (CMF) moved southwards, indicating that there were chances of BTC’s price dropping further.


Source: TradingView

