- Raydium’s shows bullish potential, but resistance and bearish signals raised concerns.
- Increasing supply on exchanges and declining network growth hinted at rising sell pressure.
Raydium [RAY] has seen remarkable weekly growth, positioning itself as one of the top-performing tokens in the decentralized finance space.
At press time, RAY was trading at $7.88, reflecting a slight 2.26% daily dip but still maintaining impressive weekly gains of over 60%.
The TD Sequential sell signal on the daily chart has raised concerns about potential bearish momentum as the price nears critical resistance levels.
Can Raydium sustain its upward trend, or is a pullback inevitable in the short term?
RAY’s price action signals mixed possibilities
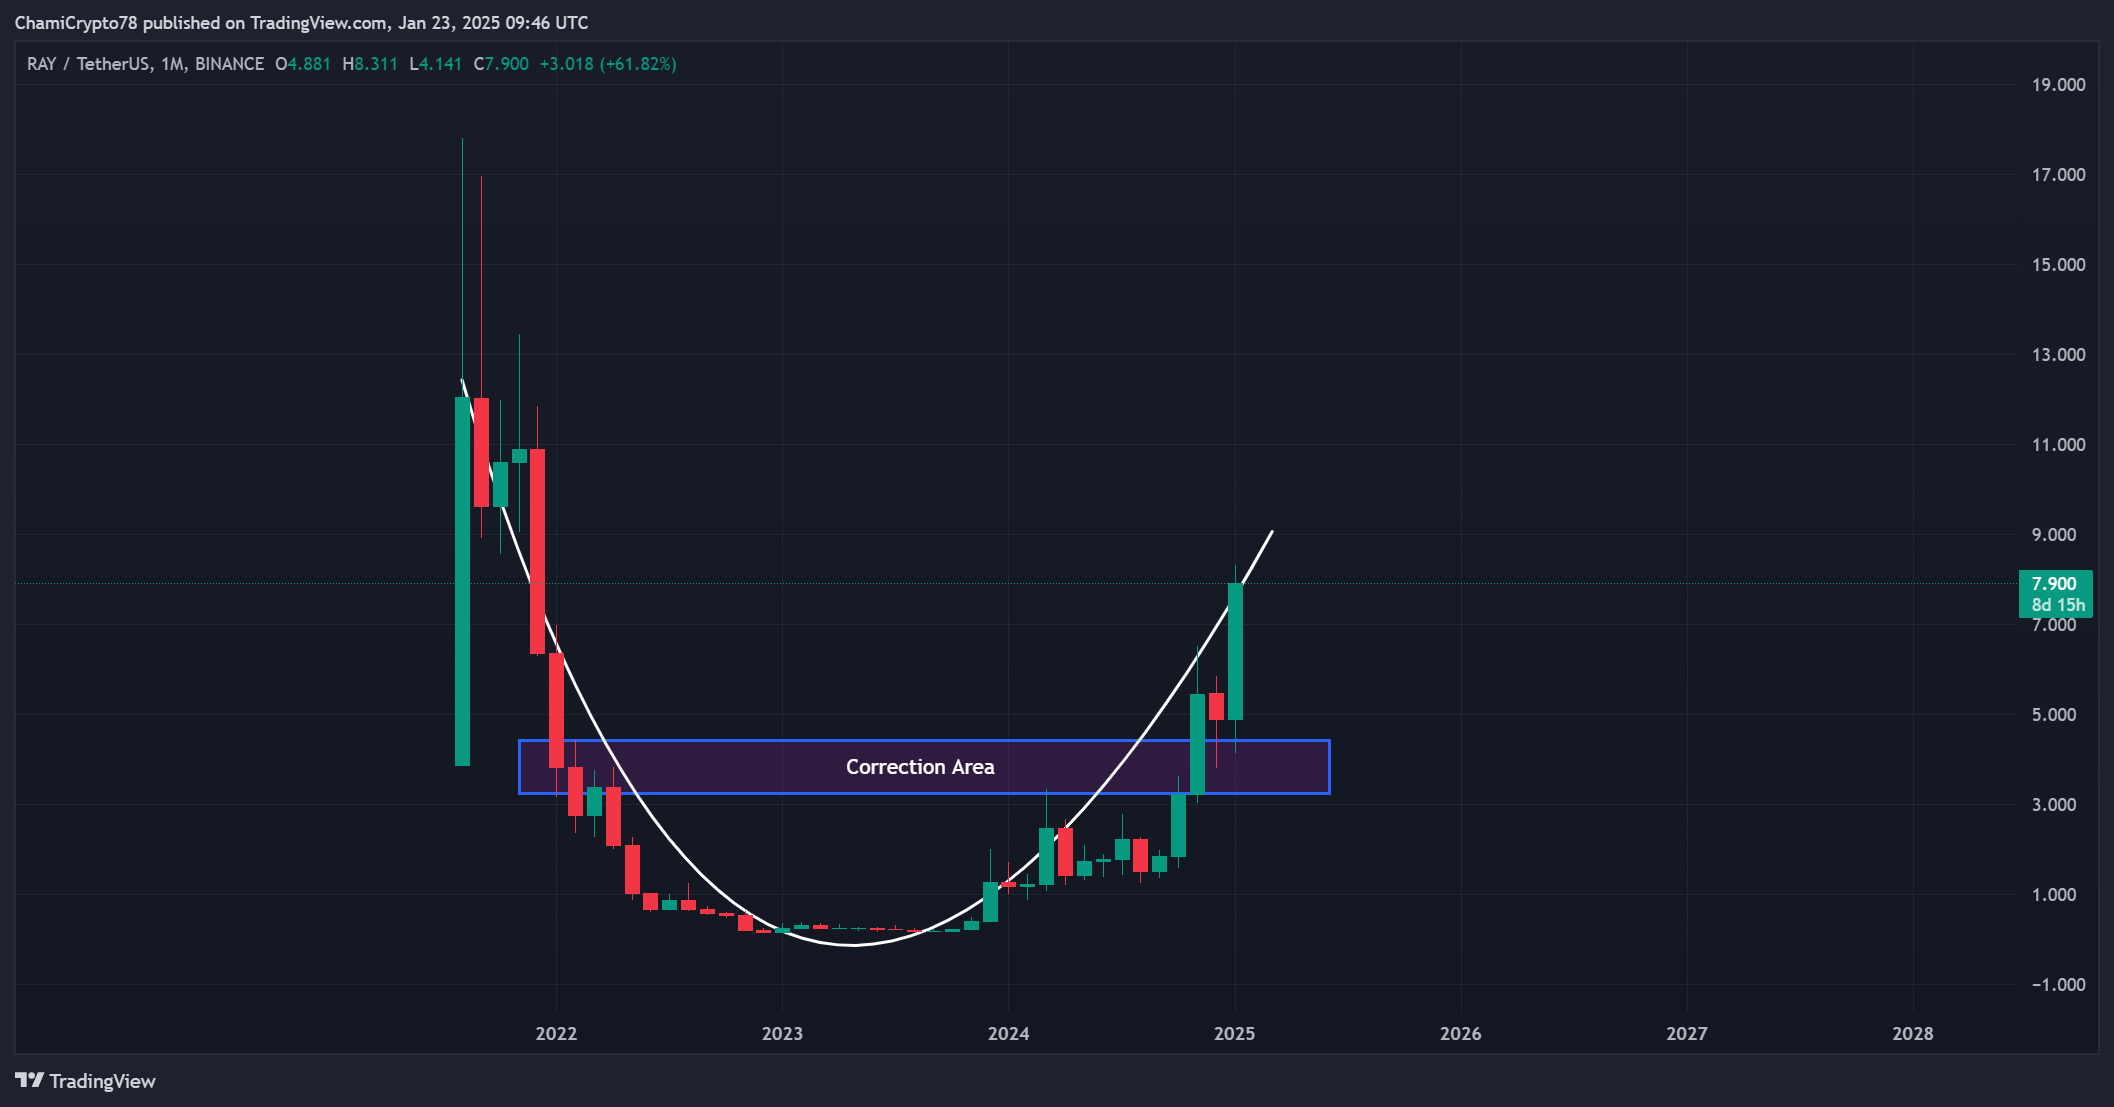
Raydium’s price breakout from the correction area has reinforced its bullish narrative. The Cup and Handle formation on the monthly chart highlights a long-term trend reversal, suggesting higher price targets.
However, the press time trading range near $8 has proven to be a strong resistance zone, with the press time dip emphasizing the struggle to maintain momentum.
If RAY fails to break above this level, a retracement could be on the cards, raising concerns for bullish traders.

Source: TradingView
DEX volume milestone shows growing interest
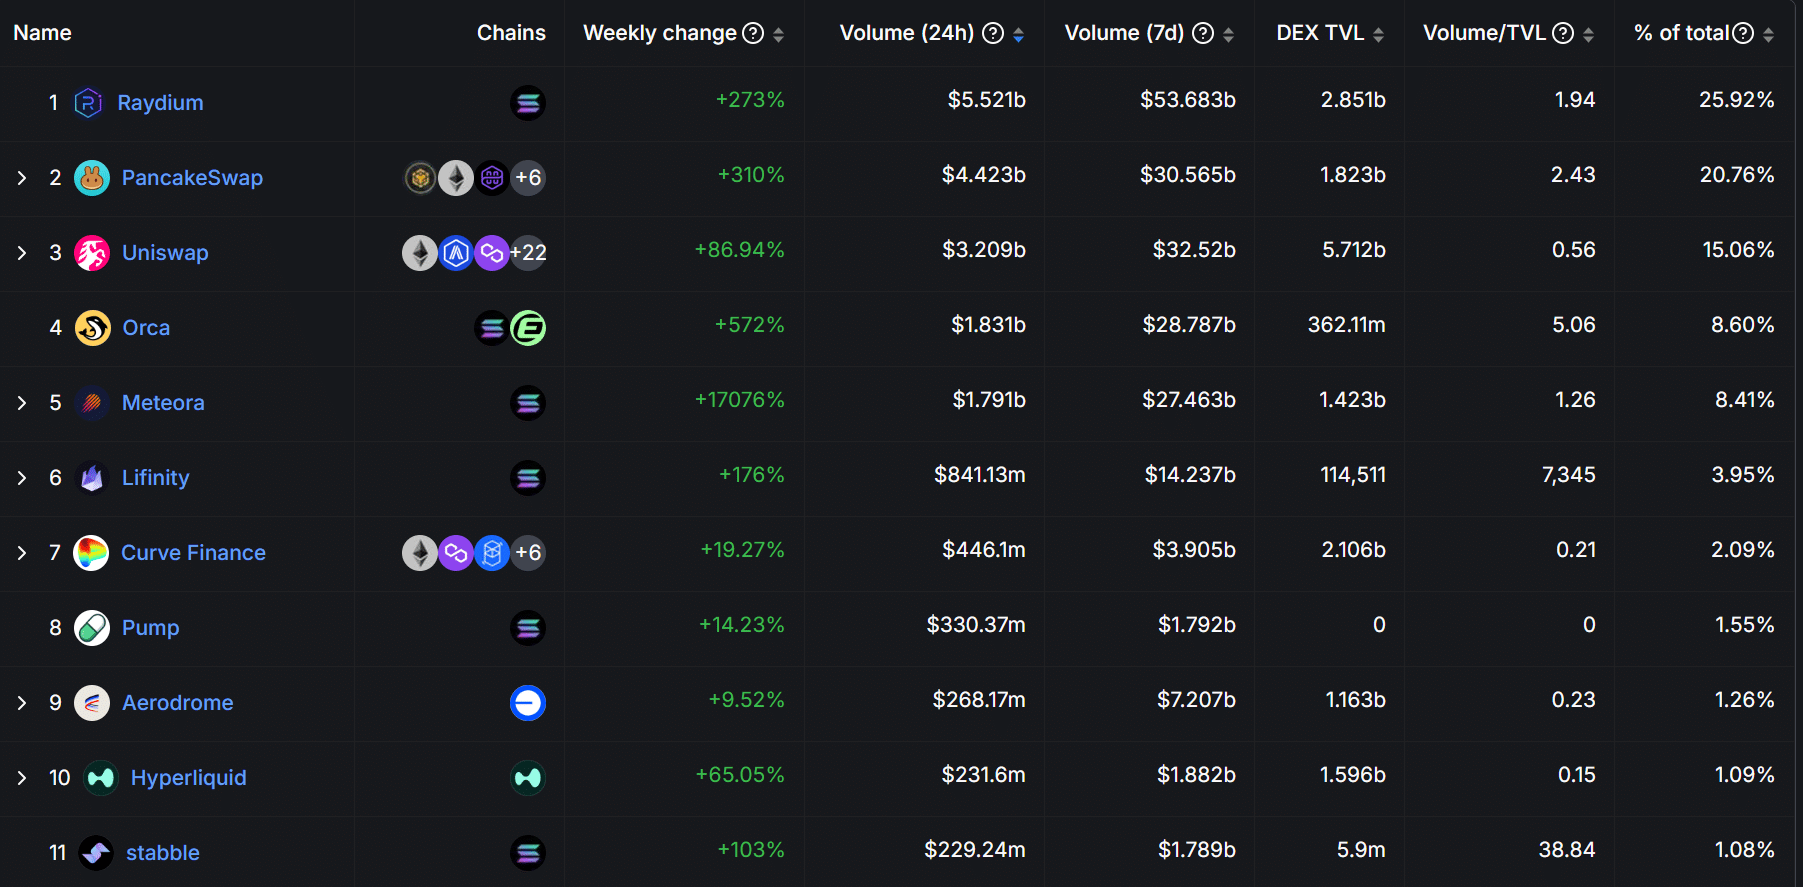
Raydium’s decentralized exchange volume has surged by 273% over the past week, reaching $53.68 billion in total activity.
This milestone demonstrates growing confidence in the platform, positioning it as the leader in weekly DEX activity.
Additionally, the robust volume suggests heightened liquidity, which could attract further market participation.
However, traders should remain cautious as such spikes often precede short-term corrections, especially when combined with bearish technical indicators.


Source: DefLlama
Declining network growth raises concerns
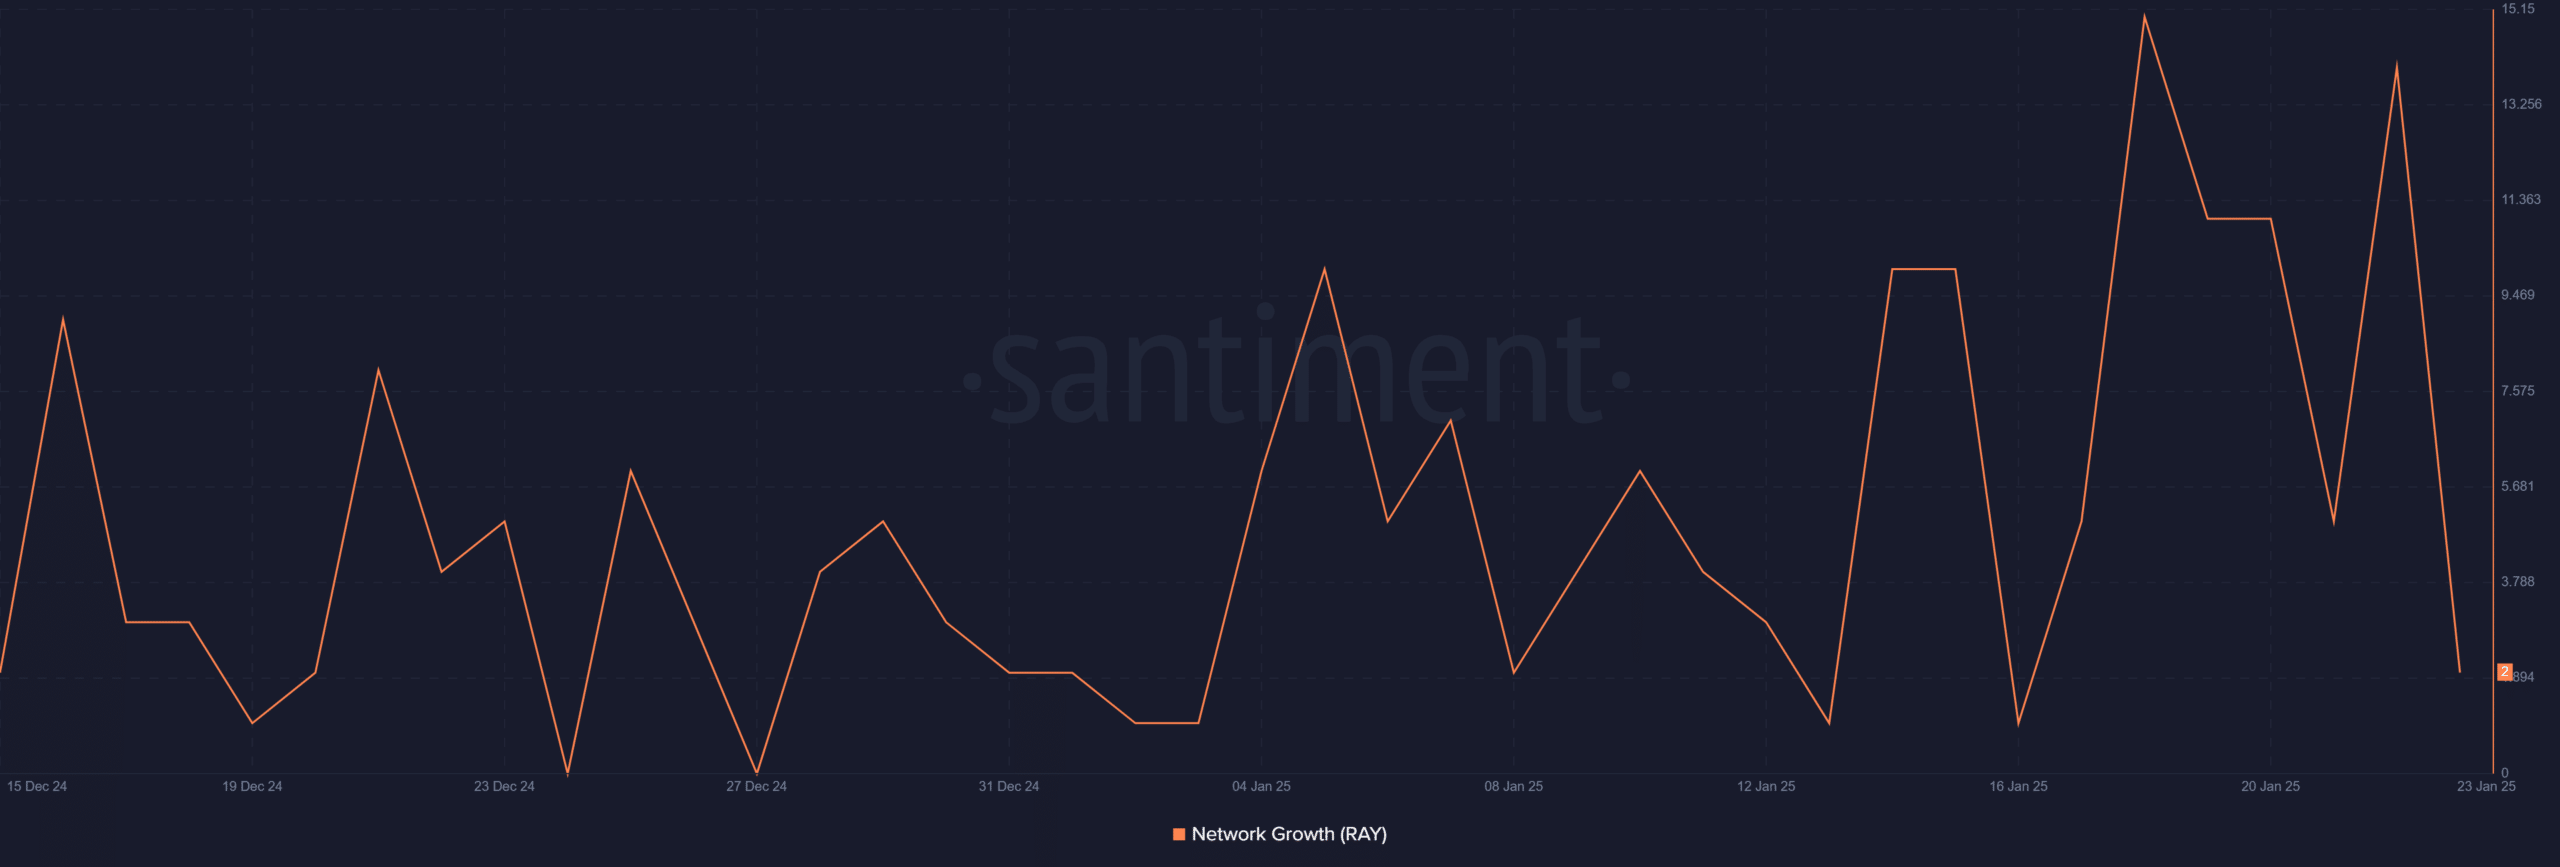
Despite RAY’s price rally, network growth has been inconsistent and is now on a downward trajectory.
The recent decrease in active and new wallet addresses signals reduced user activity, which could undermine the sustainability of the rally.
Furthermore, this decline raises questions about the token’s long-term fundamentals, despite its strong price performance.
Therefore, reviving network activity will be crucial for maintaining the current bullish sentiment.


Source: Santiment
Supply on exchanges increases sell pressure
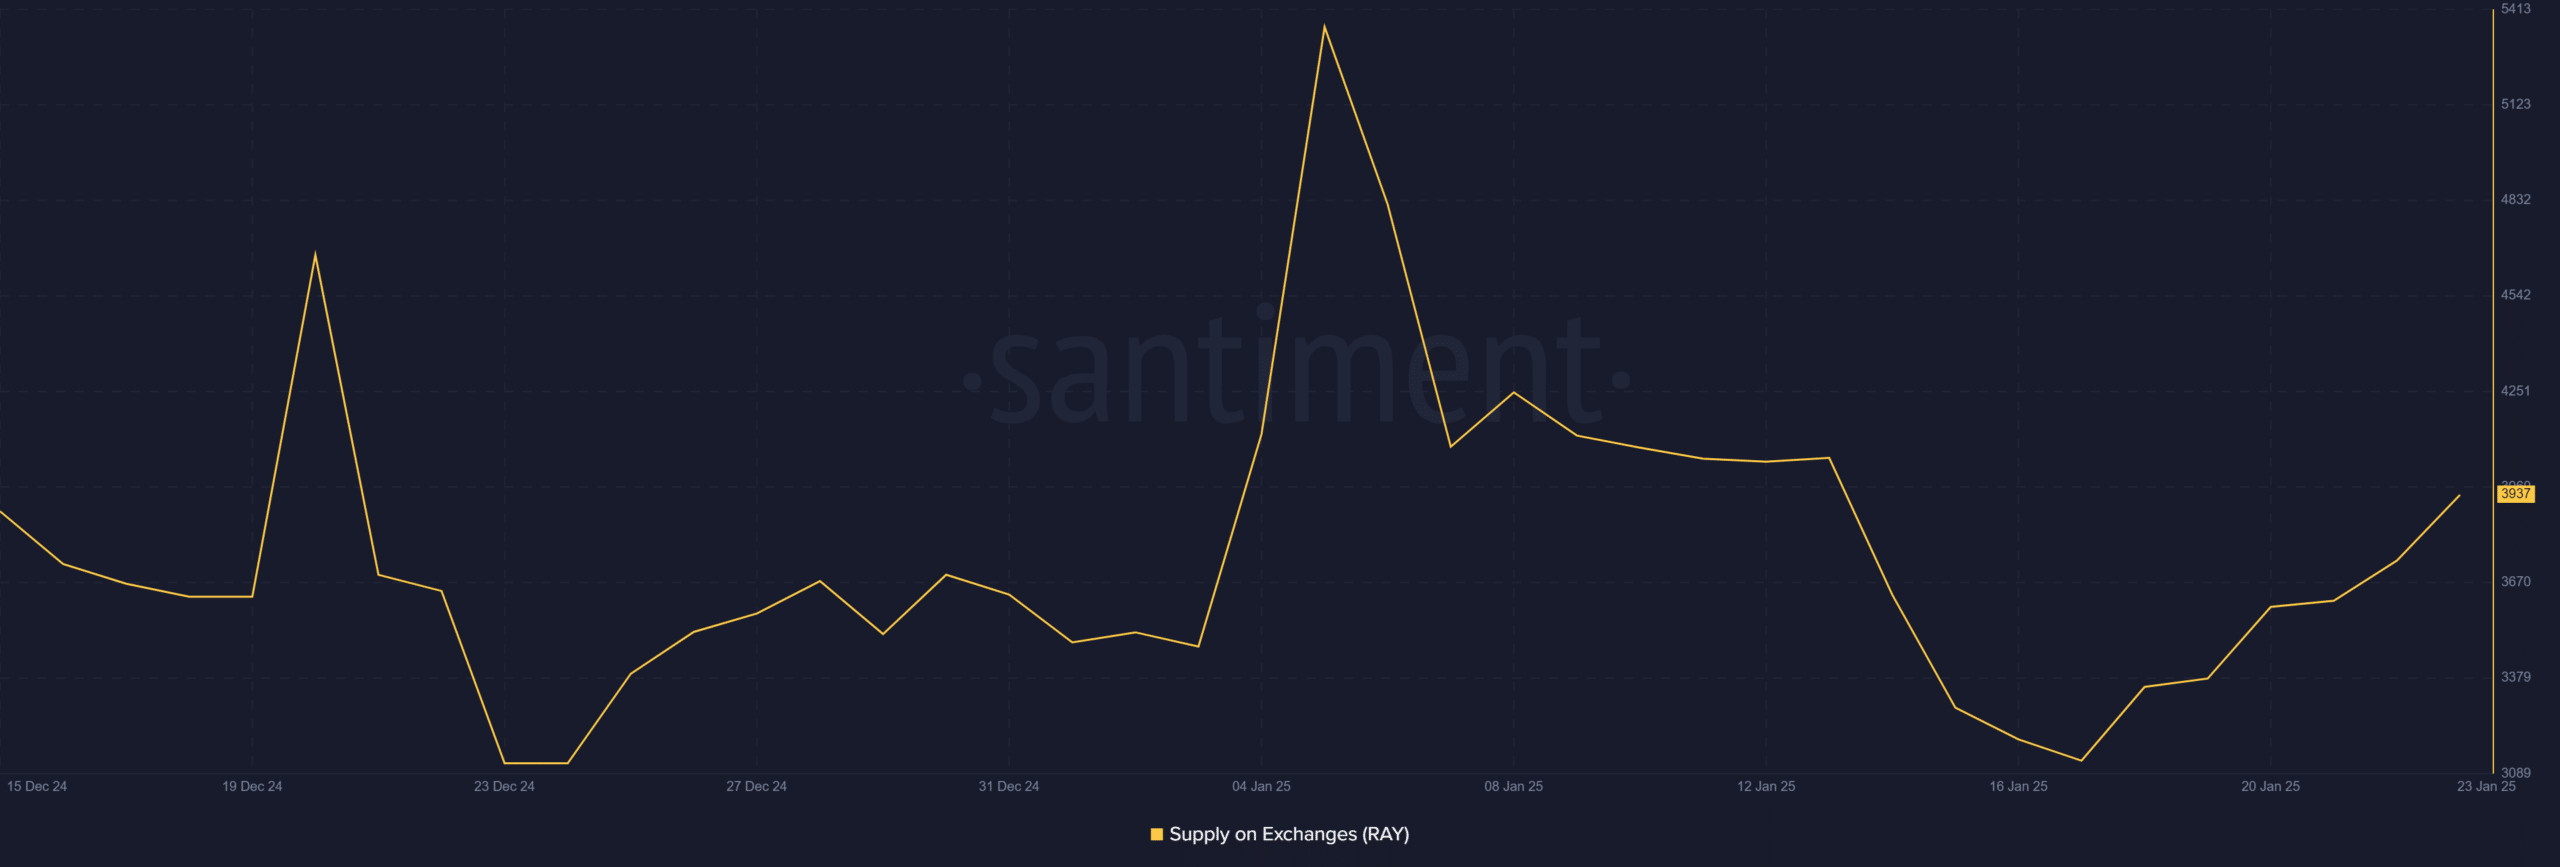
The supply of RAY on exchanges has risen to 3,937, reflecting a potential increase in sell pressure.
Historically, such movements indicate that traders are preparing to liquidate their holdings, which could lead to a price correction.
This trend aligns with the bearish sentiment identified by the TD Sequential signal, adding to the cautionary outlook. Traders should monitor this closely as it may impact short-term price movements.


Source: Santiment
RAY faces key tests for sustained growth
Raydium’s breakout and weekly volume growth demonstrated strong bullish potential, but warning signs like declining network activity and increasing sell pressure suggested caution.
Read Raydium [RAY] Price Prediction 2024-2025
While the Cup and Handle pattern indicates long-term upside, the rising supply on exchanges and near-term resistance may trigger a correction.
Ultimately, Raydium must overcome these challenges to continue its upward momentum. Will the rally hold, or will a pullback dominate? Based on current data, a short-term correction appears more likely.

