[ad_1]
- Solana’s social dominance hit record levels amid its whale distribution phase
- At press time, its technical setup suggested strong resistance at $205 with significant liquidation events
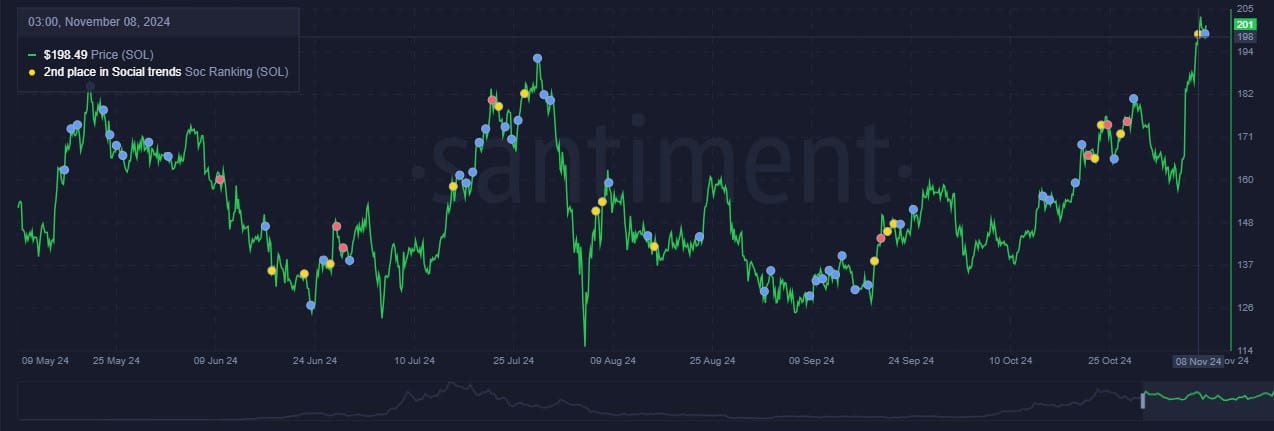
Solana’s (SOL) ecosystem is witnessing unmatched social engagement right now, with the same marking a significant shift in market dynamics.
Source: Santiment
Notably, recent data from Santiment indicated that the altcoin has claimed the second position in social trends – A sign of heightened market interest and potential price action ahead.
Solana market structure and whale behavior
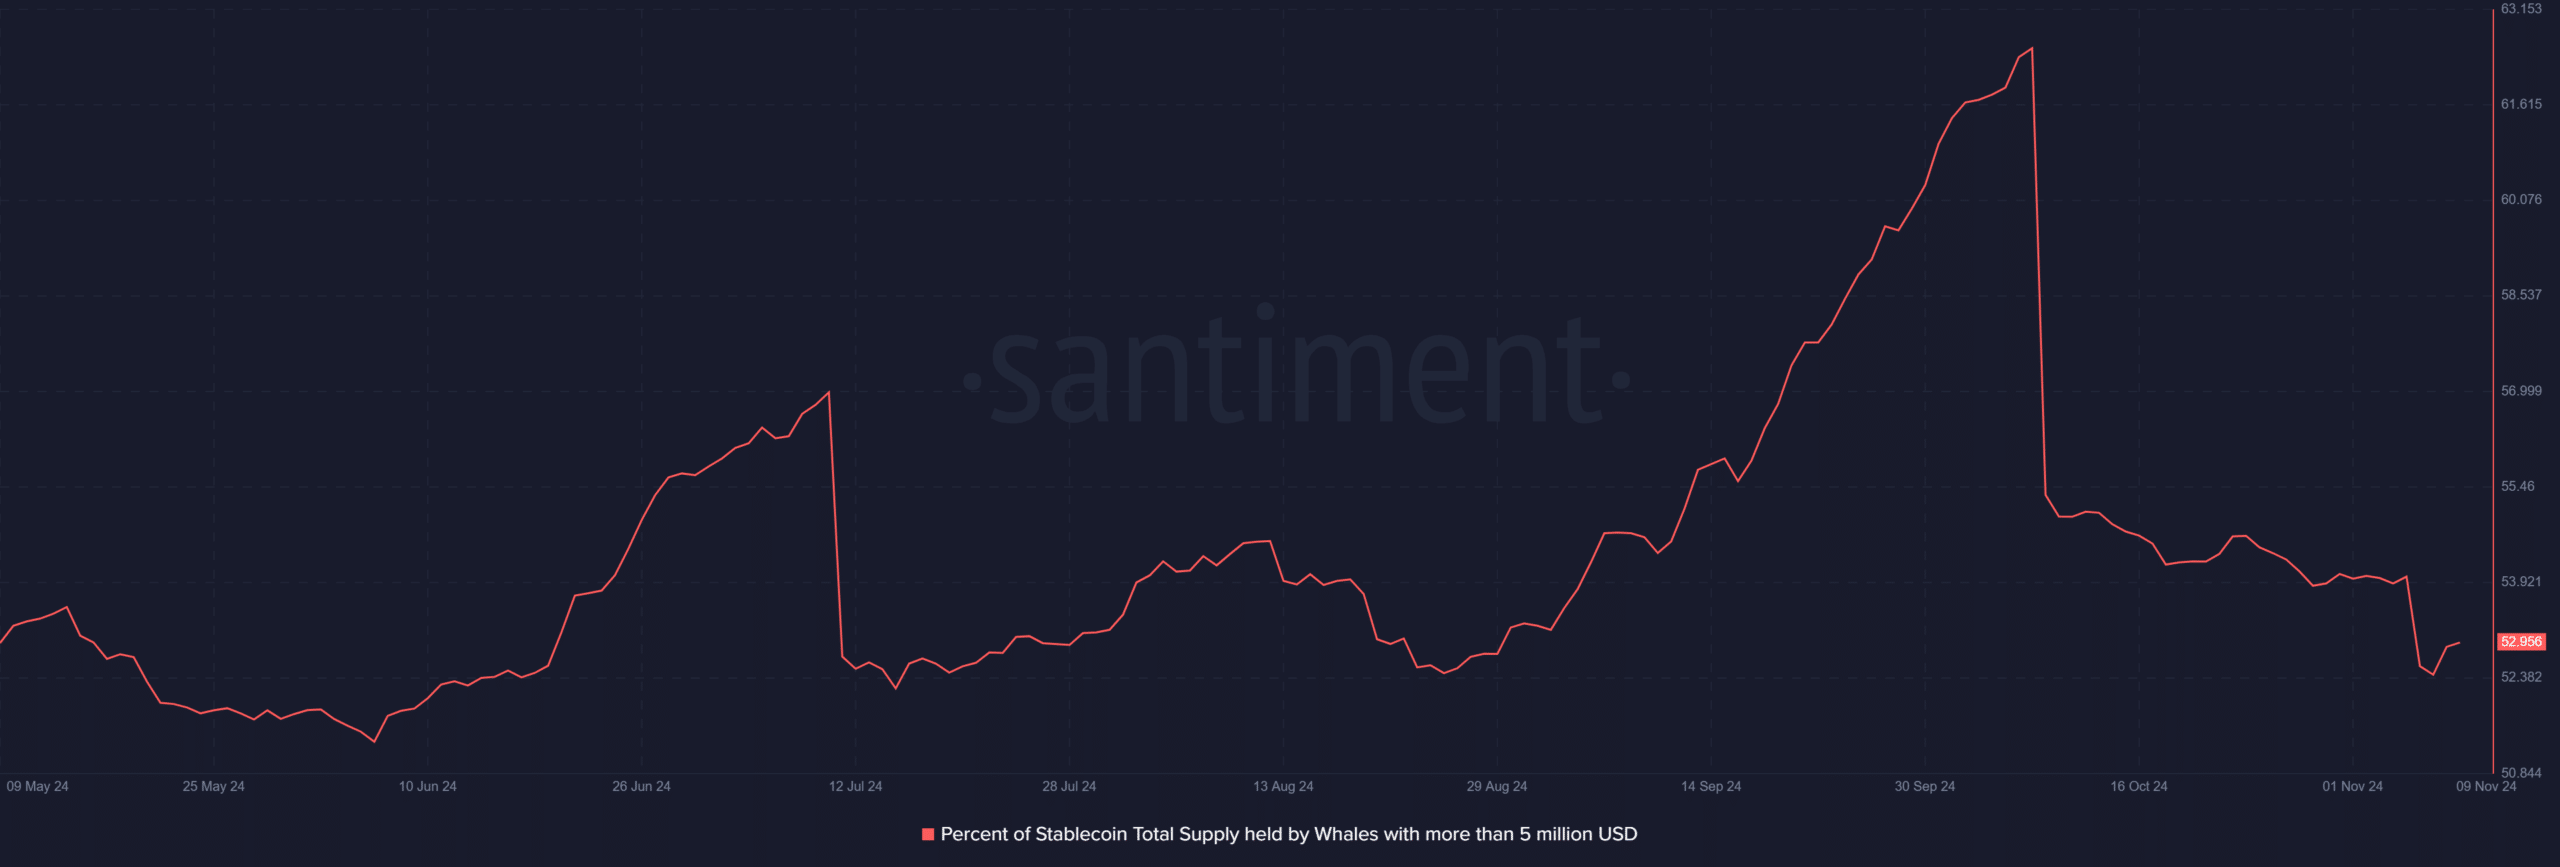
That’s not all though as a transformation in SOL’s whale holdings revealed some interesting market dynamics too. Consider this – Solana’s large holders have significantly reduced their positions since their 8 October peak.
This SOL distribution phase, rather than signaling weakness, coincided with broader market participation and a hike in retail interest.

Source: Santiment
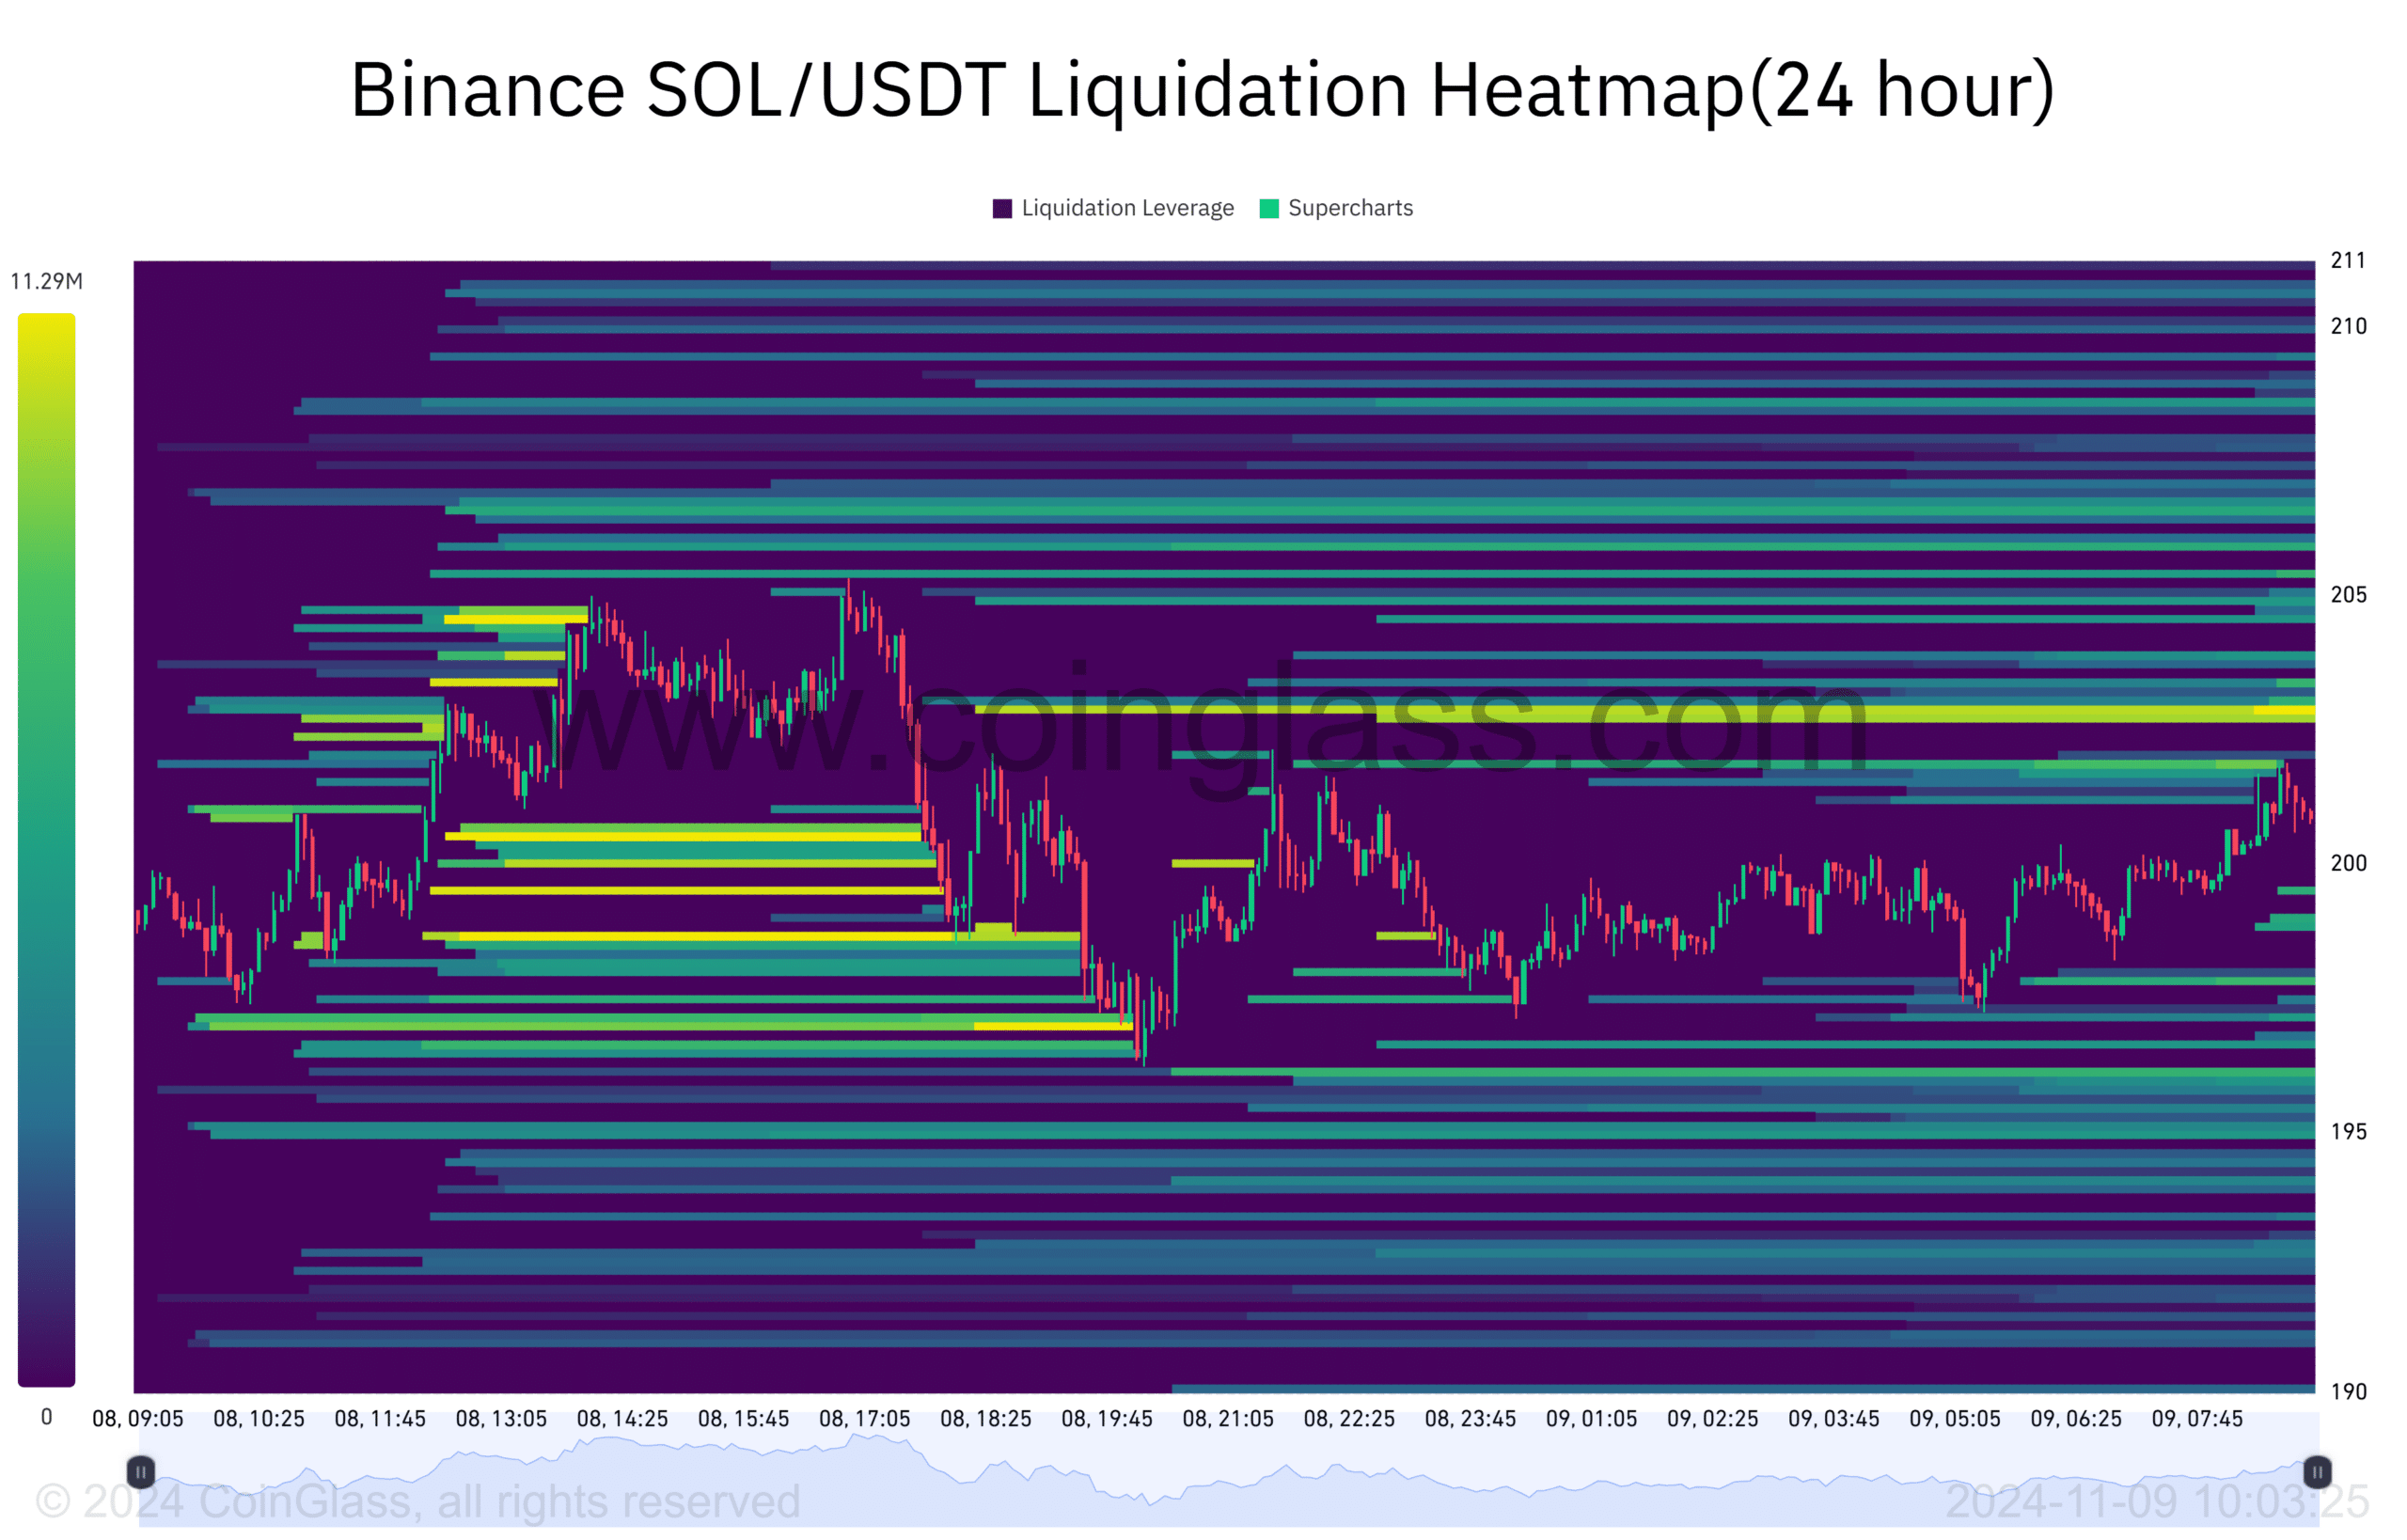
Also, the price action highlighted a clear bullish formation on the daily chart, with resistance around the $205-mark being the only obstacle in the way.
This technical pattern, combined with the liquidation heatmap showing over $12 million in potential liquidations between the $203-$205 price range, pointed to a critical price zone. One that could fuel a significant bullish rally.

Source: Coinglass
Social metrics and volume analysis
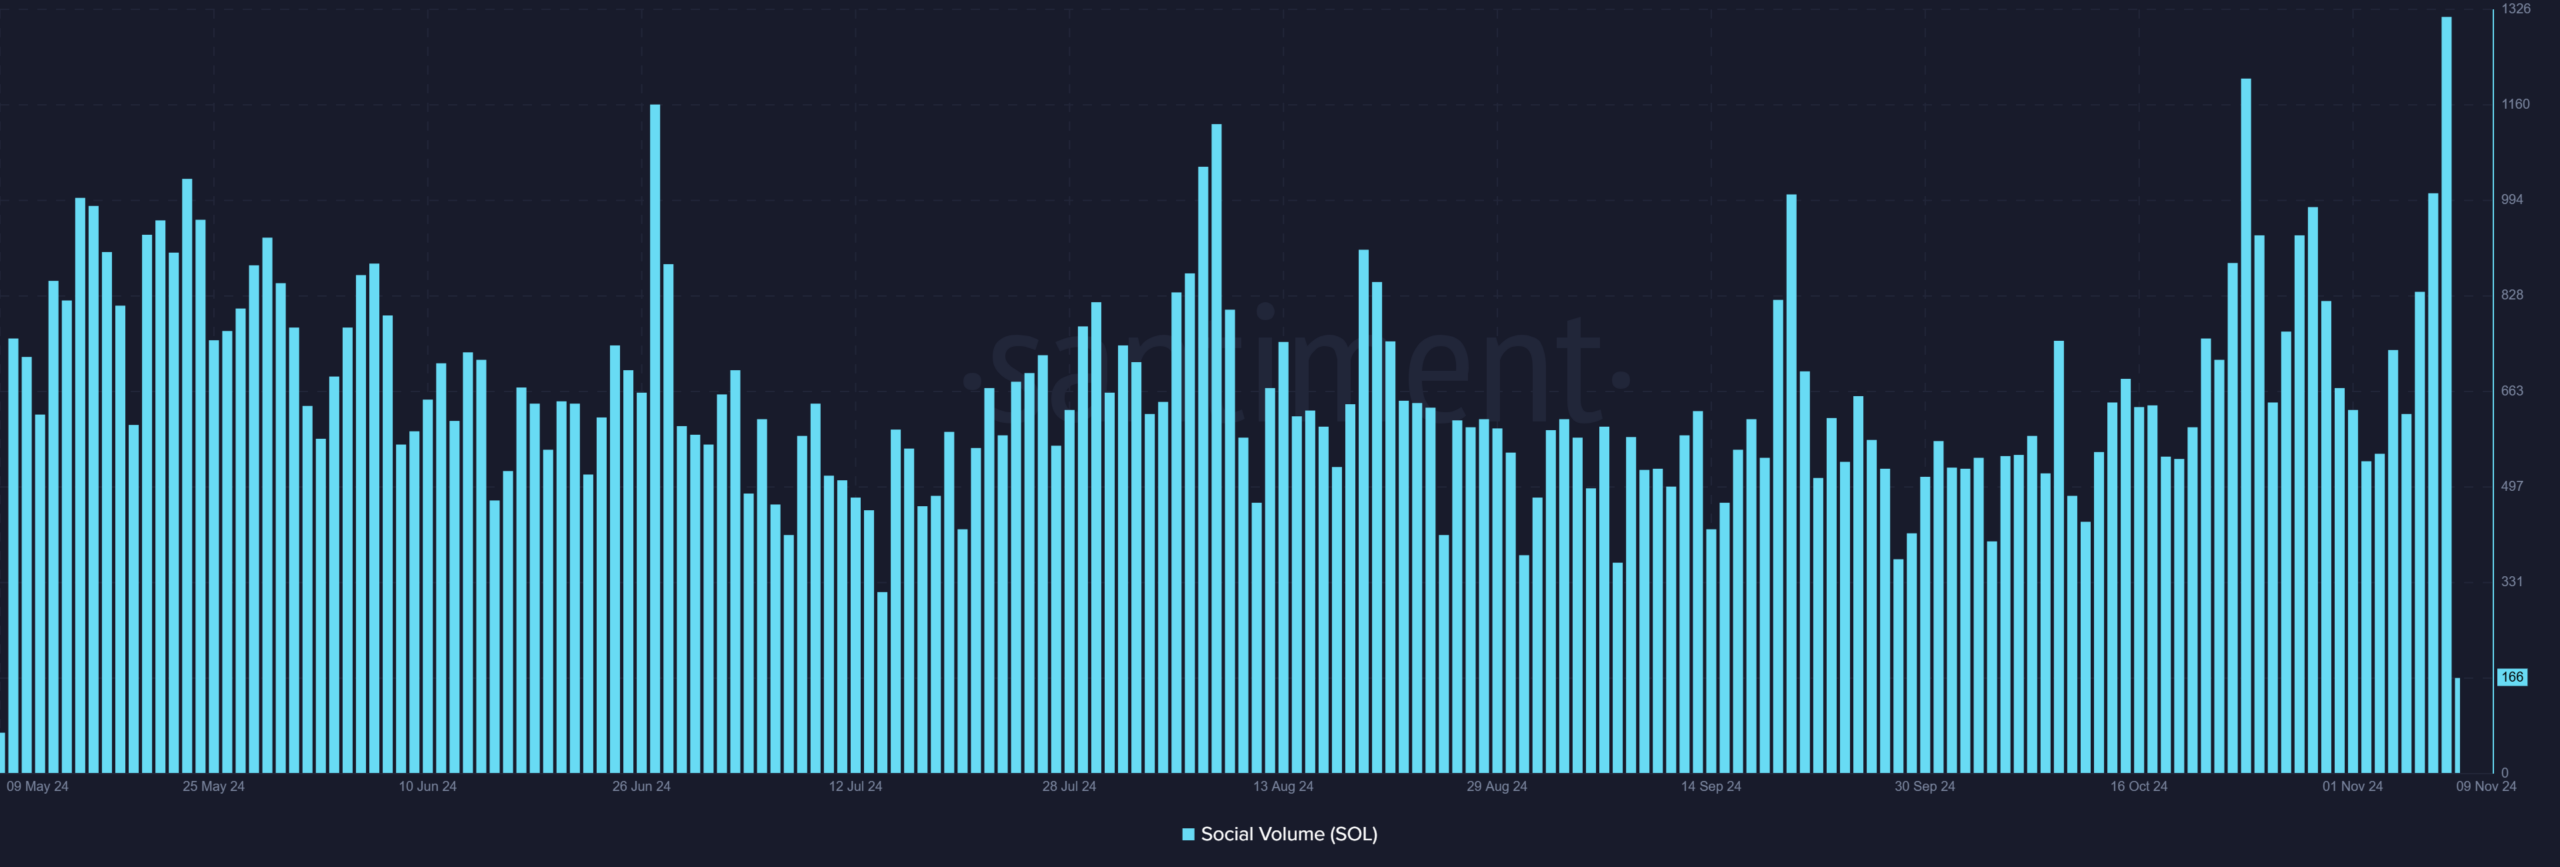
Here, it’s also worth noting that the correlation between social volume and price action presented a compelling narrative.
Solana’s social engagement metrics climbed to new all-time highs – A finding that may precede major price movements in the altcoin market.
Its latest hike in social volume seemed to differ from previous spikes by showing more consistent growth, rather than sudden bursts. Such consistency may spur investors’ confidence to take up more positions in the altcoin.

Source: Santiment
Technical outlook and market sentiment
Finally, Solana’s press time market structure pointed to a strong ascending trendline support level at around $156. This can be deemed to possibly create a solid foundation for a potential bullish run.
The liquidation heatmap’s data also revealed a concentrated zone of positions, one that could fuel a breakout if the $205 resistance is breached.
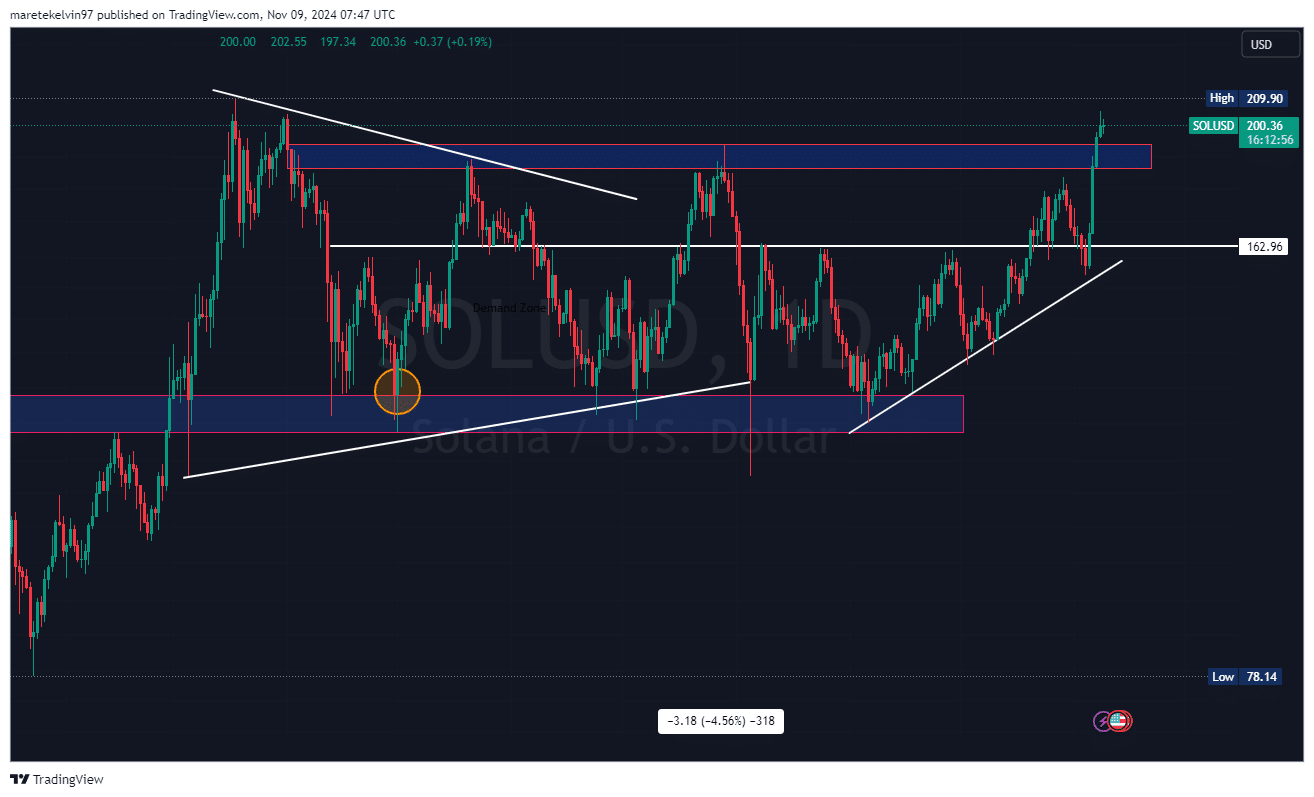

Source: TradingView
What’s next for Solana?
While social metrics and technical indicators projected a potentially bullish scenario, the market remains sensitive to broader cryptocurrency trends. The distribution of whale holdings has created a more diverse ownership structure, potentially reducing single-entity market impact.
Therefore, the confluence of high social engagement, strategic whale distribution, and clear technical levels presents a unique market setup.
Whether this combination will drive Solana to new highs depends largely on maintaining its current momentum and successfully converting the $205 resistance into support.
[ad_2]
Source link

