- SOL has depreciated by 16.17% over the last 7 days
- Analysts expecting further downside, citing a strong HTF bear pennant
Solana [SOL], the fifth-largest cryptocurrency by market cap, has recorded major losses over the past week. In fact, at press time, the altcoin was trading at $132.11. This, following a 4.02% price drop on the daily charts.
Over the past week, the altcoin has been on a strong downward trajectory. On the weekly charts, SOL declined by 16.17% after a long month of depreciation.
During what was a very volatile month of August, SOL lost over 21% of its value. Equally, SOL’s trading volume and market cap have been hit hard by the prevailing market conditions. This was best evidenced by the altcoin’s trading volume falling by 52.6% to $1.08 billion.
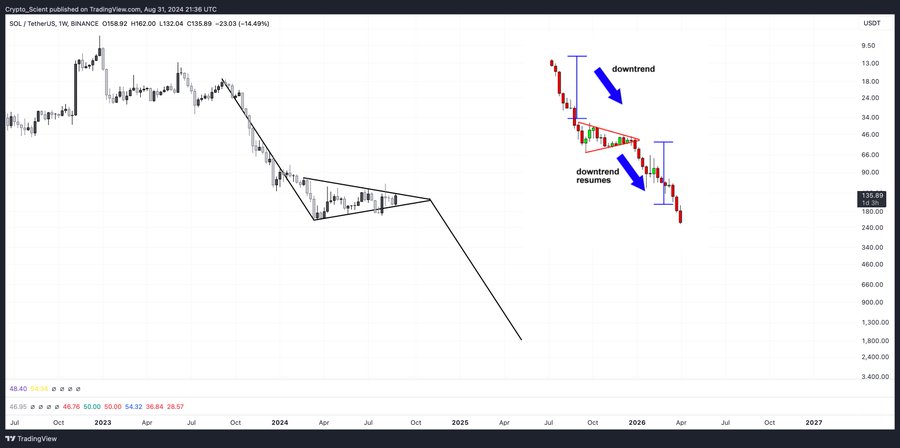
These market conditions have left analysts predicting a further decline. For example, popular crypto analyst Crypto-Scient believes that since SOL has been at the end of a 6-month-long bear pennant, the altcoin may be positioned for further decline.
What does market sentiment say?
In his analysis, Scient cited an ongoing bear pennant that has sustained itself for the last 6 months. According to the analyst, the bear pennant is a high timeframe pattern, one suggesting that the broader market sentiment is bearish.
In this particular case, that can be supplemented by SOL’s weekly and monthly charts too.
Source: X
Notably, when a crypto’s trend is set like this, it suggests the price is likely to continue to head down after a period of consolidation.
The analysts went on to claim that we might see SOL consolidate within a tight range over the next 4-6 weeks. A breakout will follow this period of consolidation, however.
A breakout from this pennant to the downside would result in the continuation of the previous downtrend. In such a scenario, the scale of the crypto’s decline will depend on the flagpole on the charts.
What do the price charts say?
Outside of what the altcoin’s charts may be suggesting, it’s also important to assess Solana based on other parameters too.
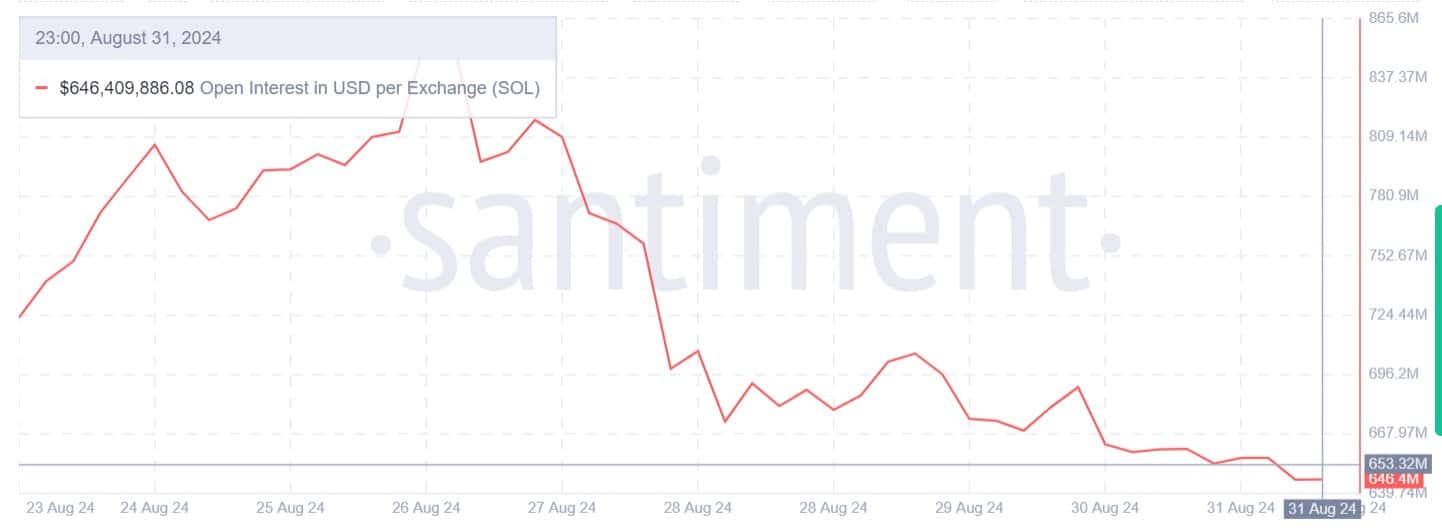
Source: Santiment
For starters, Solana’s Open Interest per exchange has declined over the past 7 days from $857 million to $646 million.
This may be a sign that investors are closing their positions, without opening new ones. Such sentiment also indicates investors’ lack of confidence in SOL’s price direction. Owing to the same, some might even be encouraged to sell to avoid more losses.
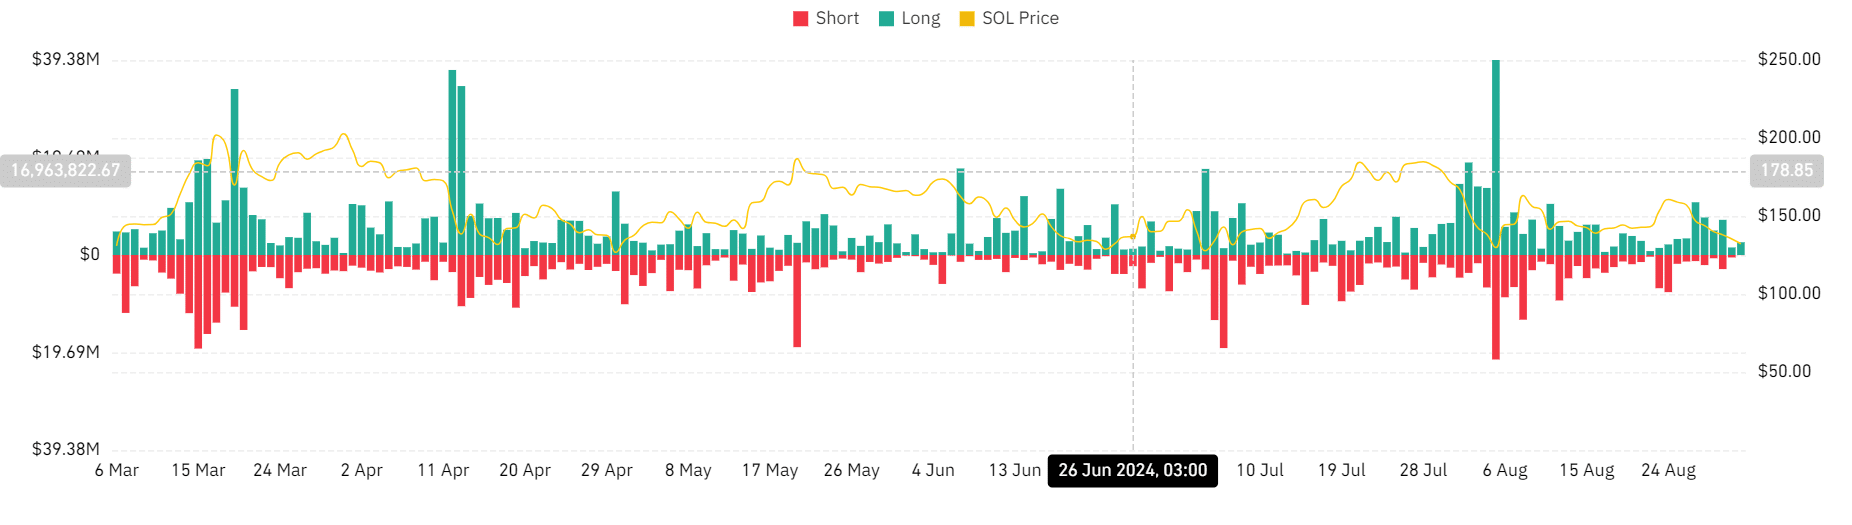
Source: Coinglass
Additionally, SOL’s long-position liquidations have remained high over the past 7 days.
At the time of writing, long position liquidations stood at $2.57 million, while short positions were $28.9k. What this means is that investors betting on the price to increase are being forced out of their positions.
Such a scenario implies the market is bearish and long position holders lack the conviction to pay the premium – Another bearish sign.
Source: Coinglass
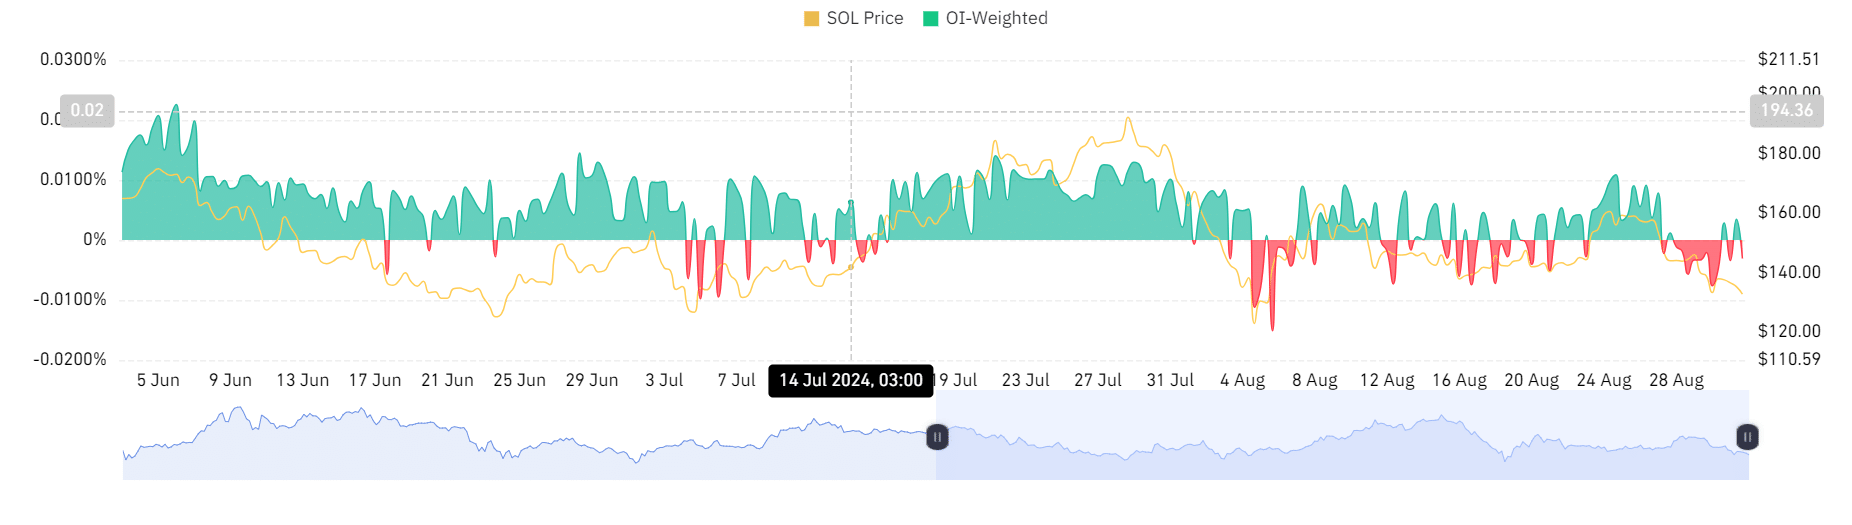
Finally, the OI-weighted funding rate was negative with a reading og -0.0031%. This is a sign of reduced demand for long positions.
Right now, SOL is on a sustained downward trajectory. If the ongoing market conditions hold, Solana may be well-positioned to decline further on the charts. Therefore, based on this analysis, SOL might fall to the lower level of the flagpole to go past $110.