
- Bitcoin, at press time, recorded gains of almost 11% on the weekly charts
- Analysts are eyeing $64,300 after a possible breakout from $61,625
Bitcoin [BTC] has defied market expectations and historical patterns to turn September blue. In fact, at the time of writing, BTC was trading at $60,164. This marked a 3.94% hike on the daily charts and gains of 10.96% on the weekly charts.
Prior to these gains, however, BTC was on a downward trajectory, with the crypto remaining below $60k since 29 August. And yet, despite this uptick, BTC remains over 18% below its ATH of $73,937 from March.
Needless to say, Bitcoin defying history to see green in September has many analysts talking. Ali Martinez is one of them, with the popular analyst now claiming that BTC will hit $64,300 citing active addresses.
What does market sentiment say?
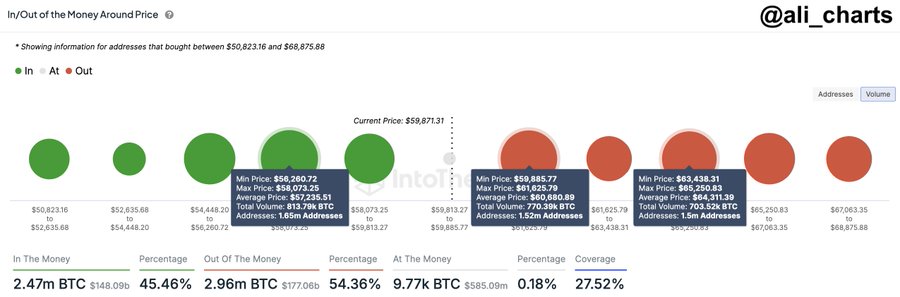
In his analysis, Martinez cited the current 1.52 million addresses holding over 770,000 BTC at a range between $59,885 and $61,625.
Source: X
In context, this range represents a resistance zone, one implying it is the area where many holders might choose to sell and take profits. When a huge number of addresses hold assets at specific price levels, these levels turn into resistances. This is because holders may decide to sell when the price approaches the range where they bought. Such market behavior may result in selling pressure, which slows upward momentum.
However, according to the analyst, if the crypto surpasses the $61,625 resistance level, it will see further gains. This would indicate that any selling pressure at this level would be absorbed, paving the way for further price gains. In this case, the next level will be $64,300.
Consequently, if the price fails to break above this resistance zone and remains below $61,625, it could cause a pullback. This short-term downward movement could have BTC retrace to $57,235 before attempting another move north.
What do the charts say?
Since closing on lower lows on 7 September, BTC has noted a strong upswing. Although the 1.52 million addresses highlighted by Martinez may decide to sell, the prevailing market conditions could allow BTC to register more gains on the price charts.
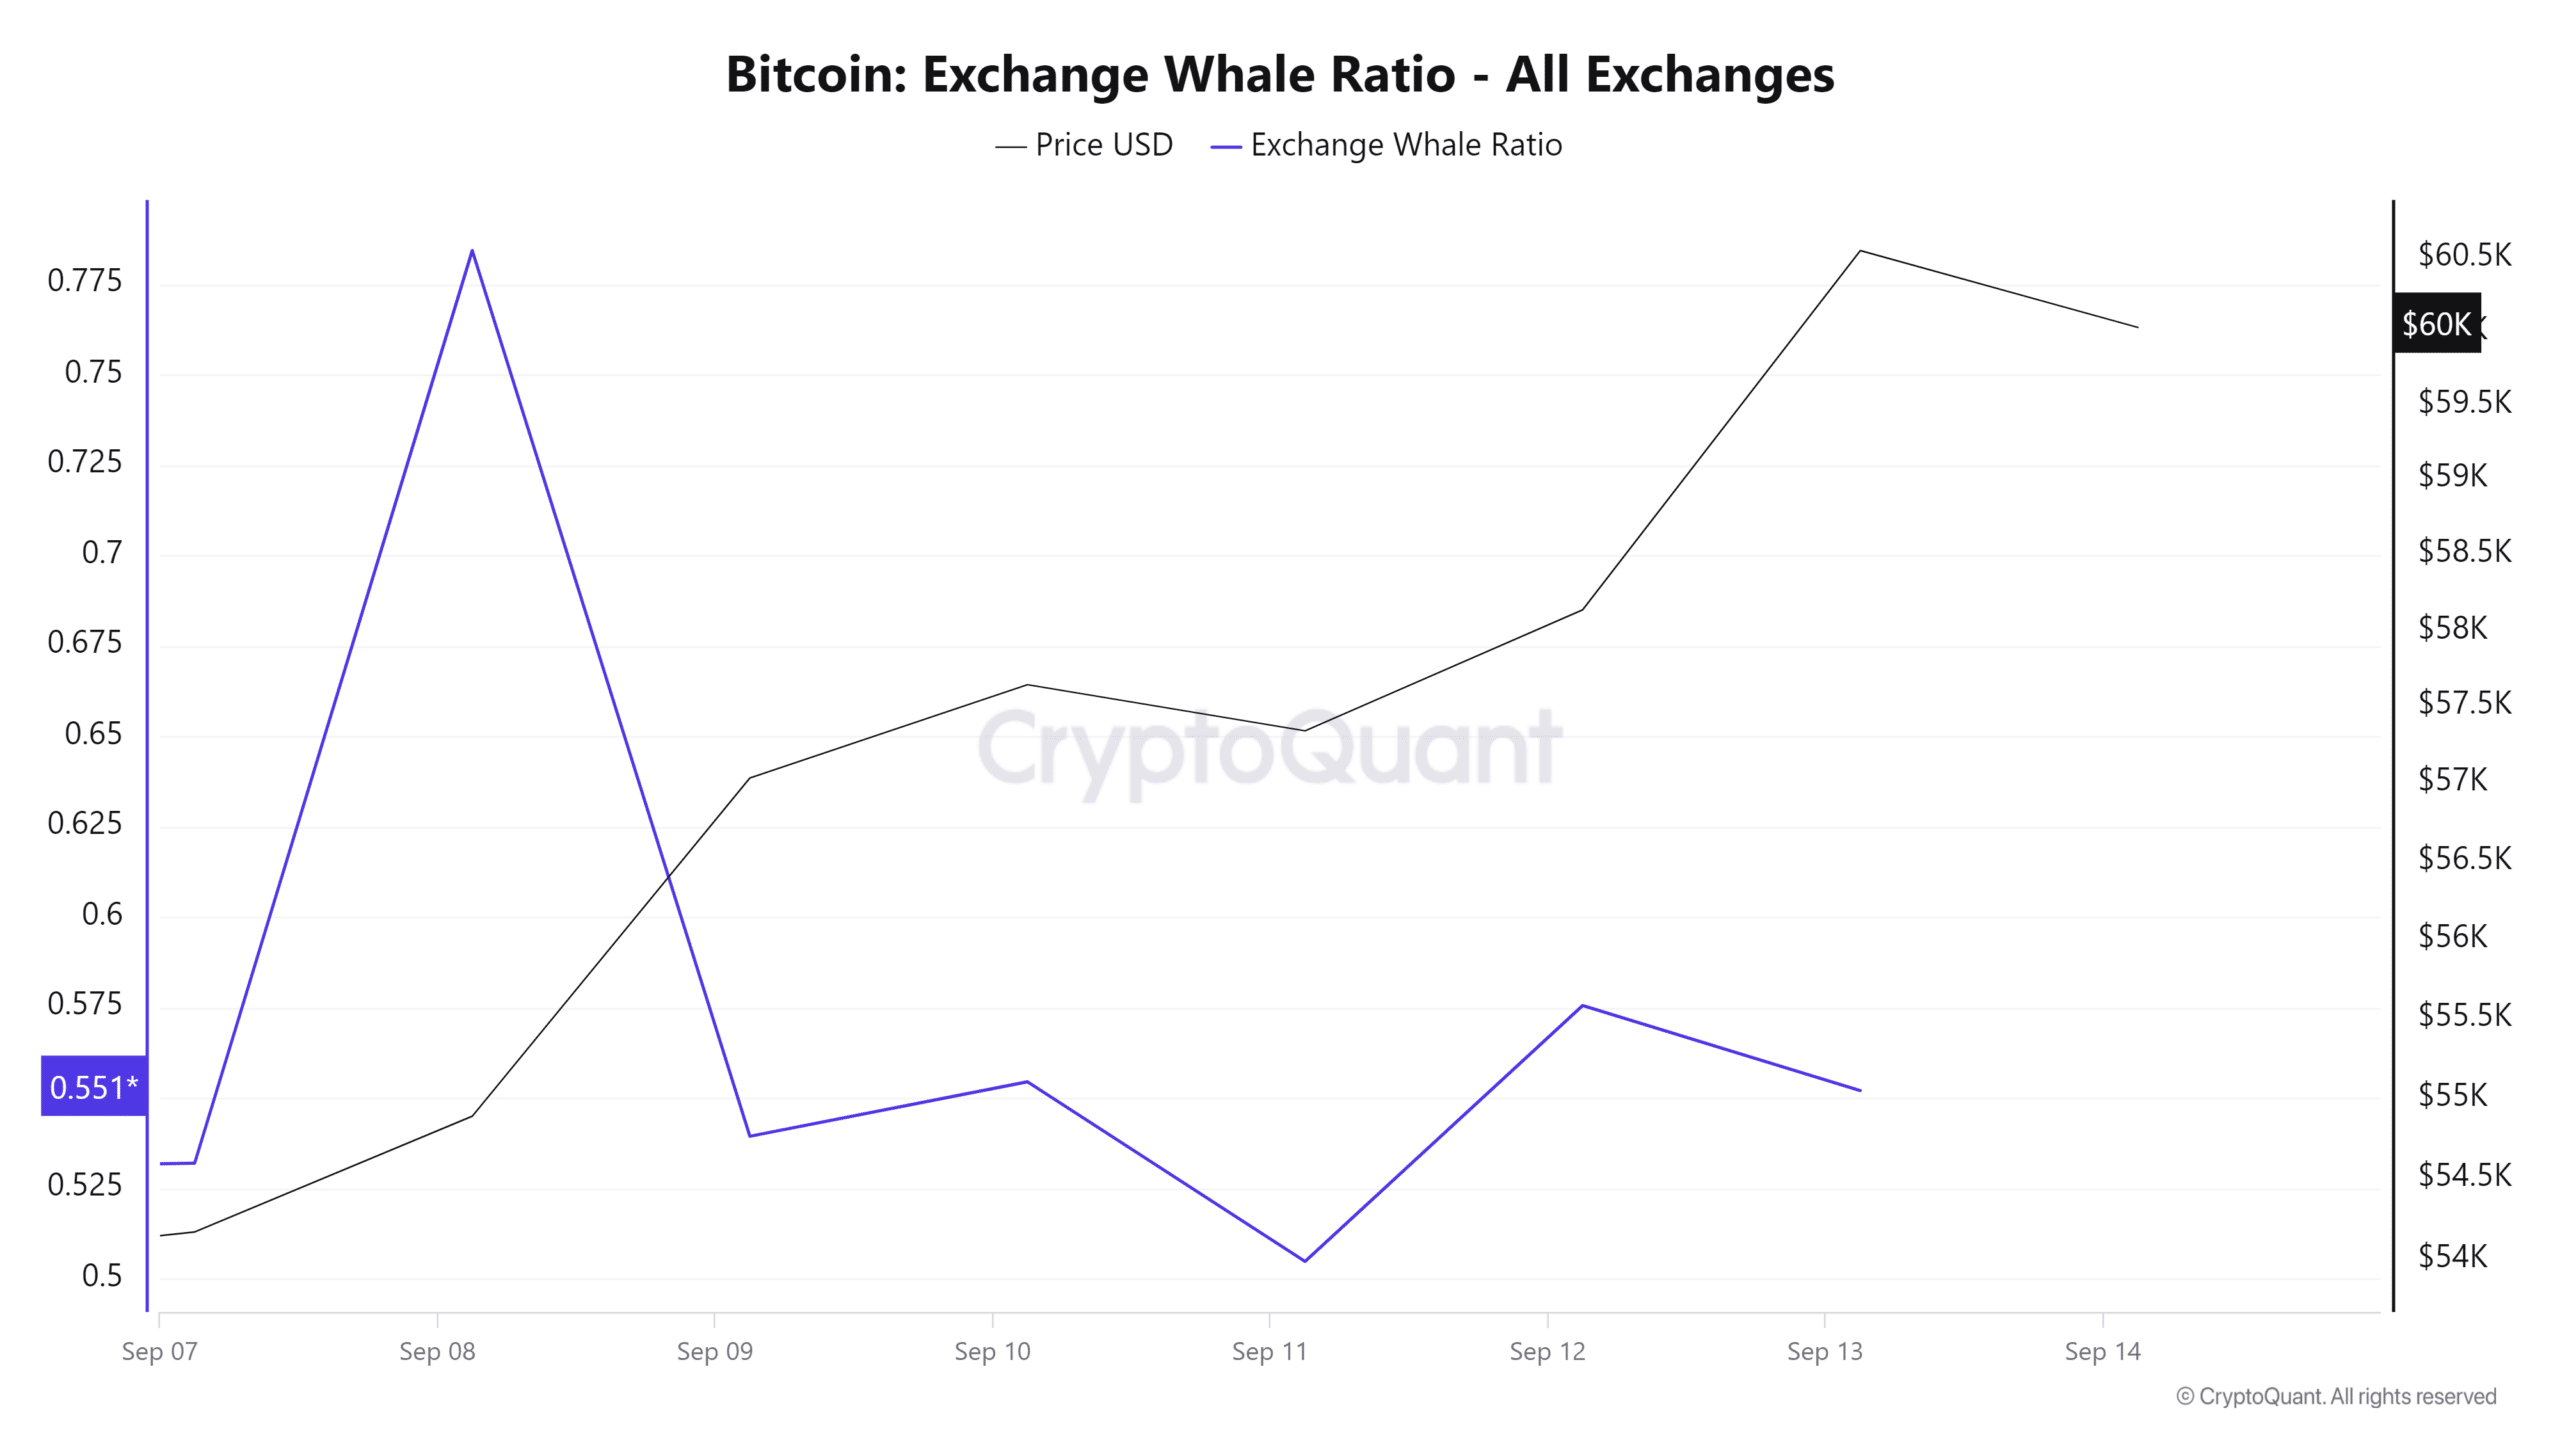
Source: Cryptoquant
For example, the exchange whale ratio declined from 0.7 to 0.5, suggesting large holders are not preparing to sell in the short term.
This decline means that whales are holding their assets in private wallets. Such market behavior is a sign of a long-term bullish outlook from whales, especially as they expect further price gains.
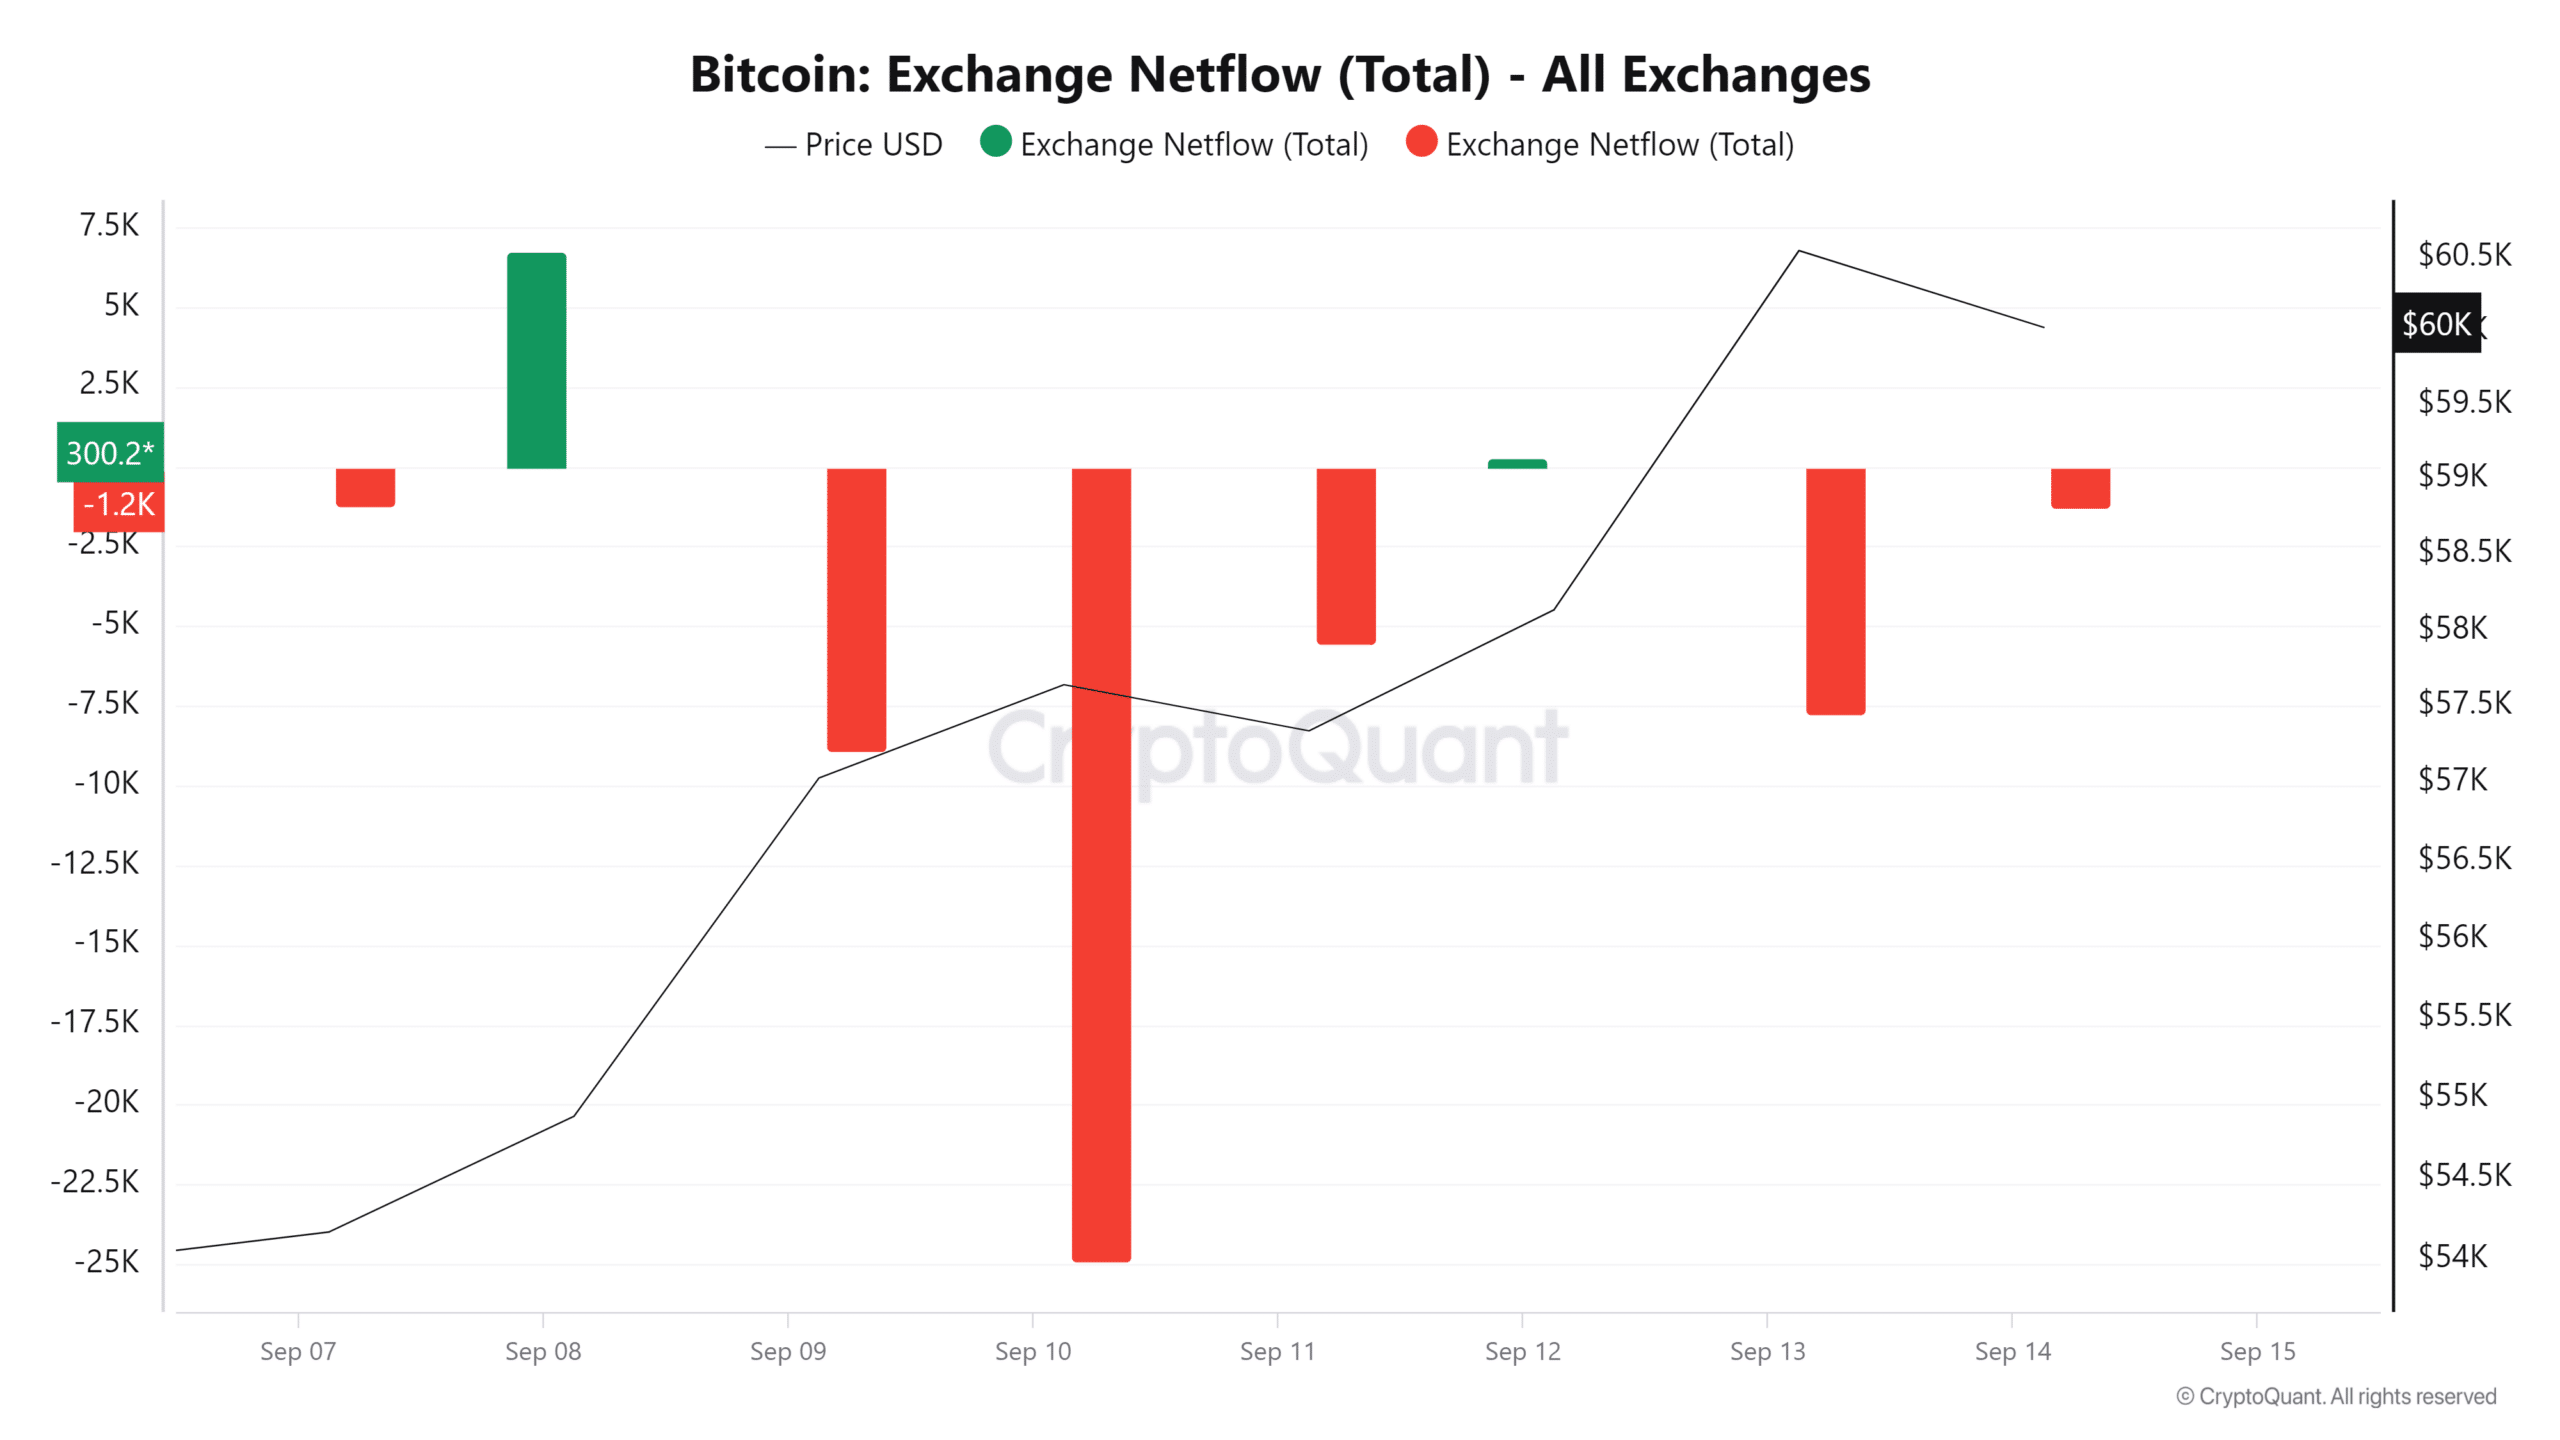
Source: CryptoQuant
Additionally, Bitcoin’s exchange netflows have been largely negative since 9 September.
Negative netflows suggest investors are withdrawing their assets from exchanges to store them in cold wallets. This is another bullish signal because it means that holders have no immediate intention to sell. By doing so, they are reducing supply on exchanges, precipitating a northbound move.
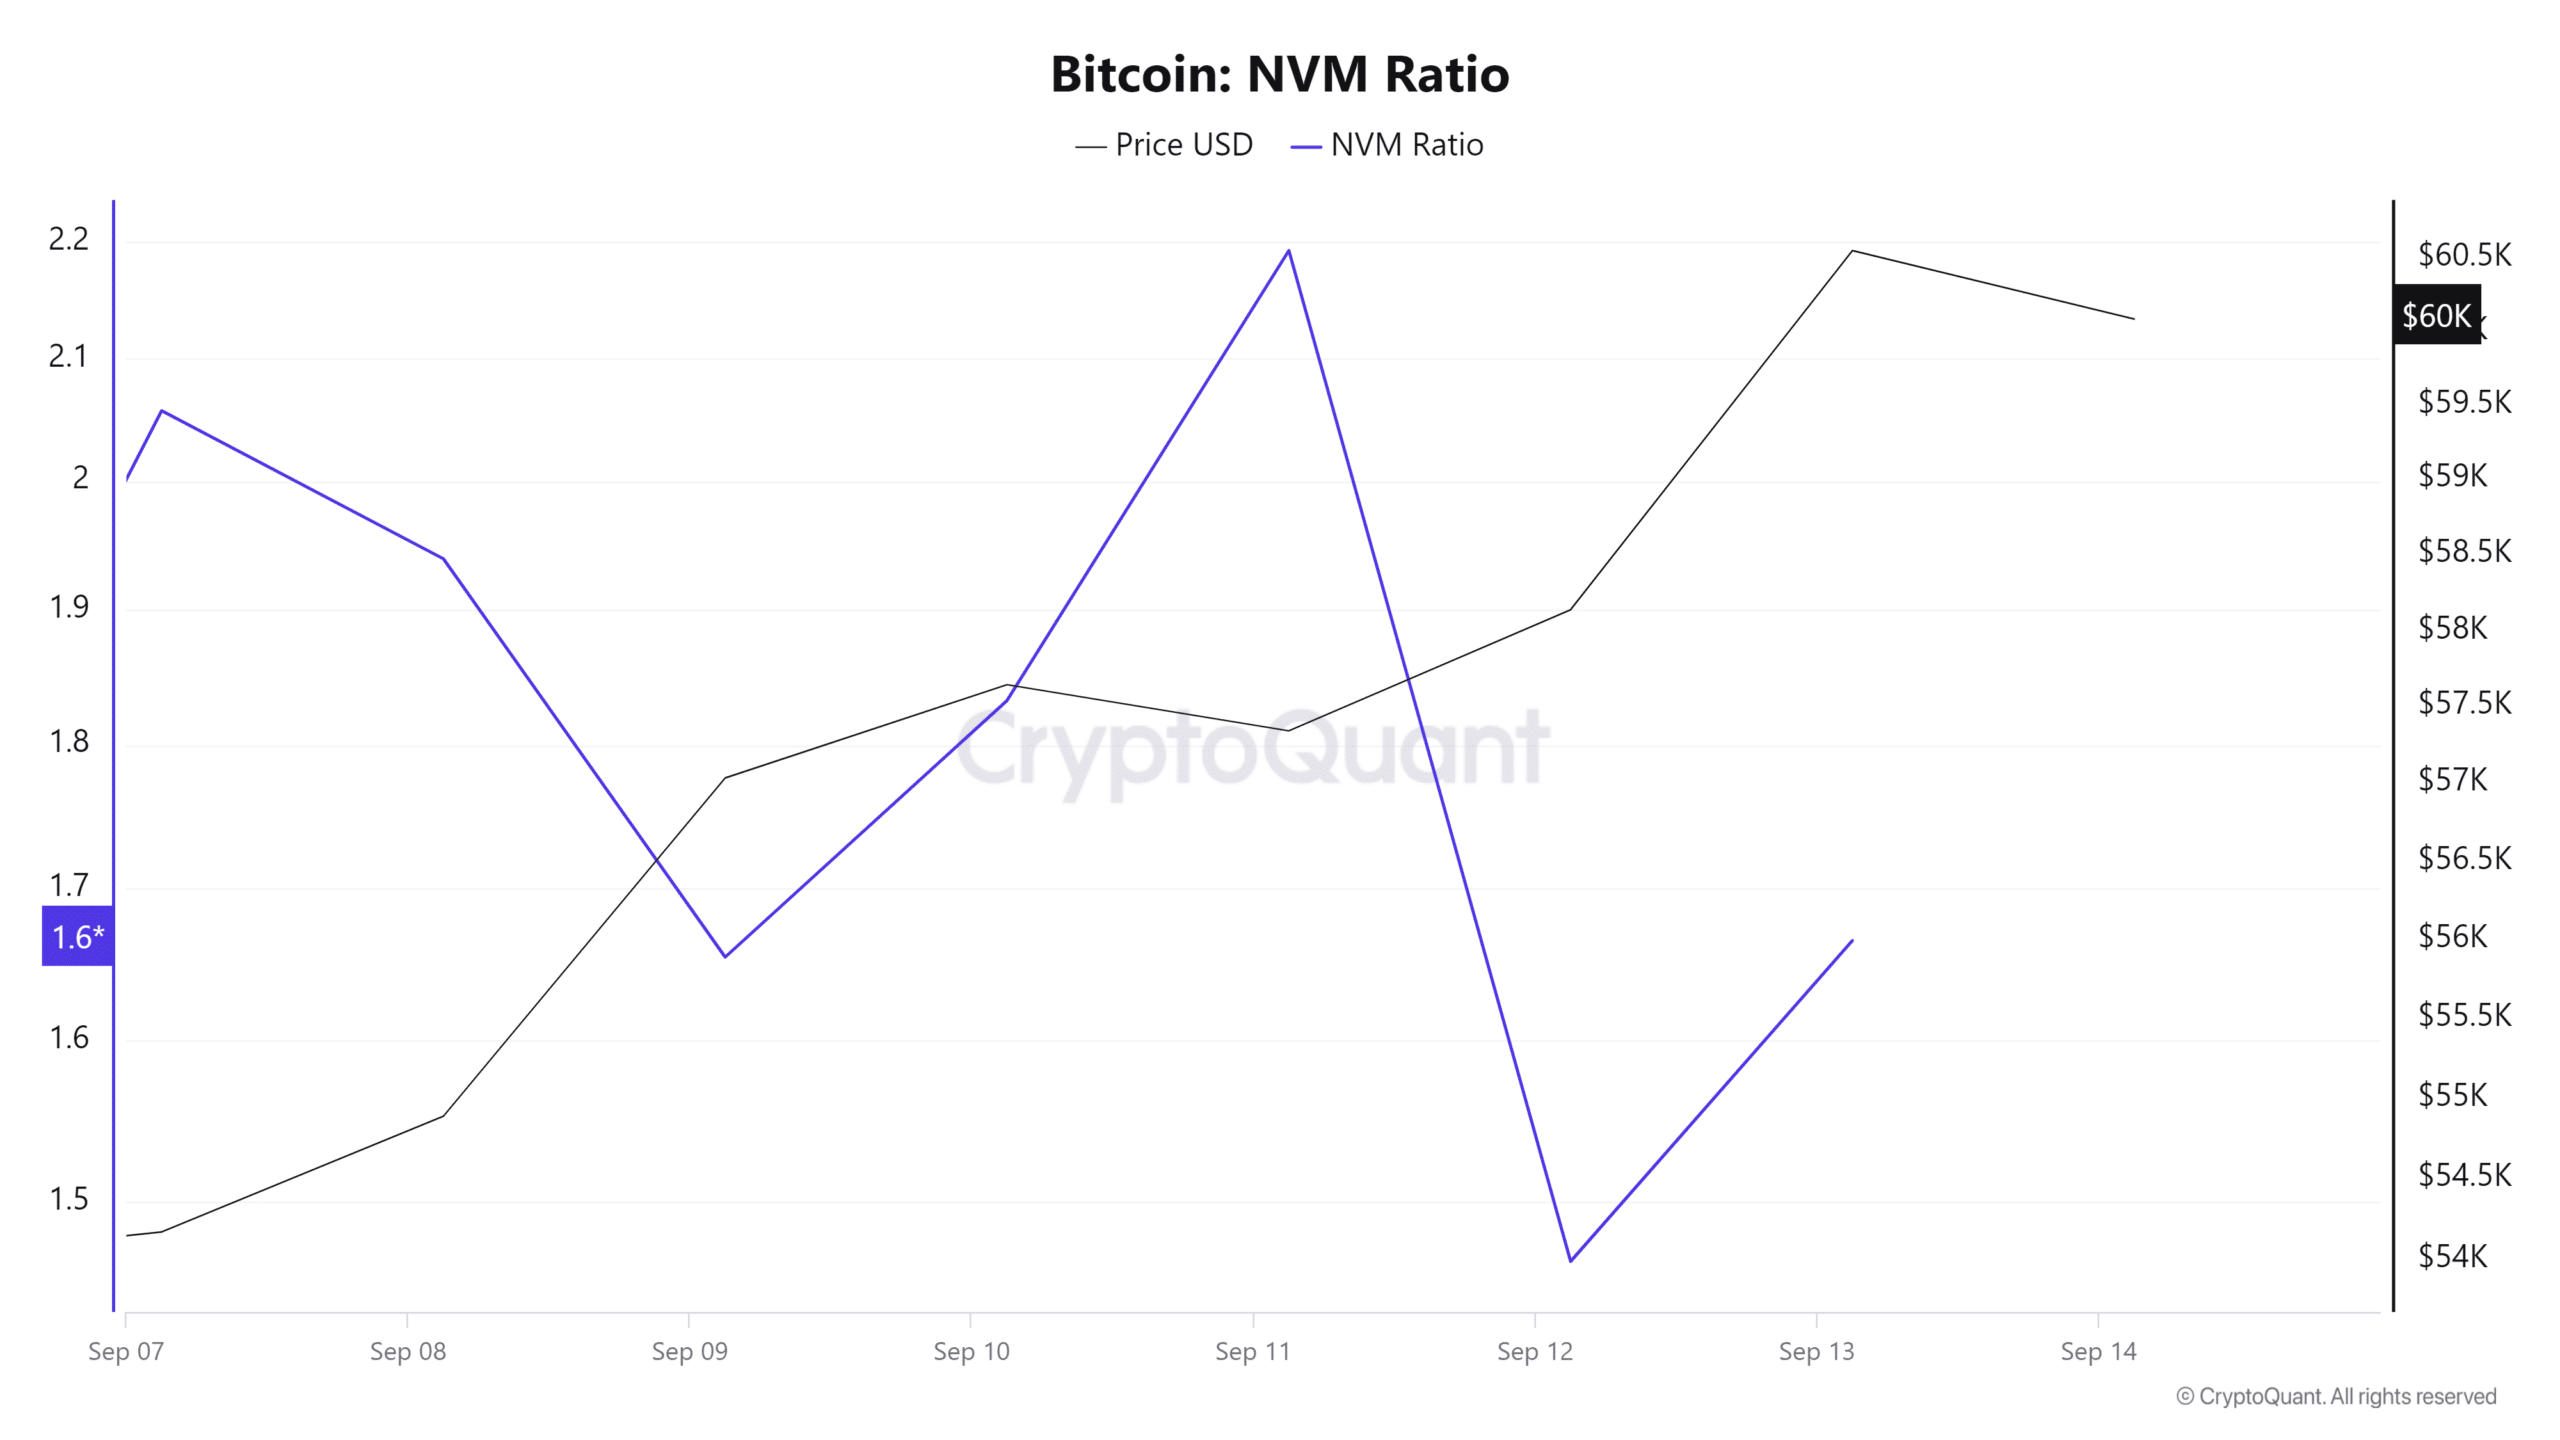
Source: CryptoQuant
Finally, Bitcoin’s NVM ratio has been declining – Another bullish signal as it implied the strengthening of network fundamentals.
Now, while the network is strengthening itself, the market is yet to fully price the growth. This could mean accumulation in anticipation of a price rally.
In light of its positive market sentiment, if these market conditions hold, Bitcoin will challenge the $64,300 resistance level.