- VeChain had a $2.13 billion market cap at press time, underlining potential growth in RWA tokenization, VeBetterDAO adoption
- VeChain’s price rise and high trading volume could be good news if sustained well
VeChain’s current market position presents a notable opportunity for investors and holders. With its advancements in real-world asset tokenization and adoption through VeBetterDAO, VeChain is now positioned for potential growth in the coming months.
At the time of writing, VeChain (VET) was trading at $0.02633, marking a 0.84% hike in the last 24 hours. Its trading volume over the aforementioned period was upwards of $337 million too, with the crypto ranked 43rd on the market capitalization charts.
Analysts’ view on buying opportunity
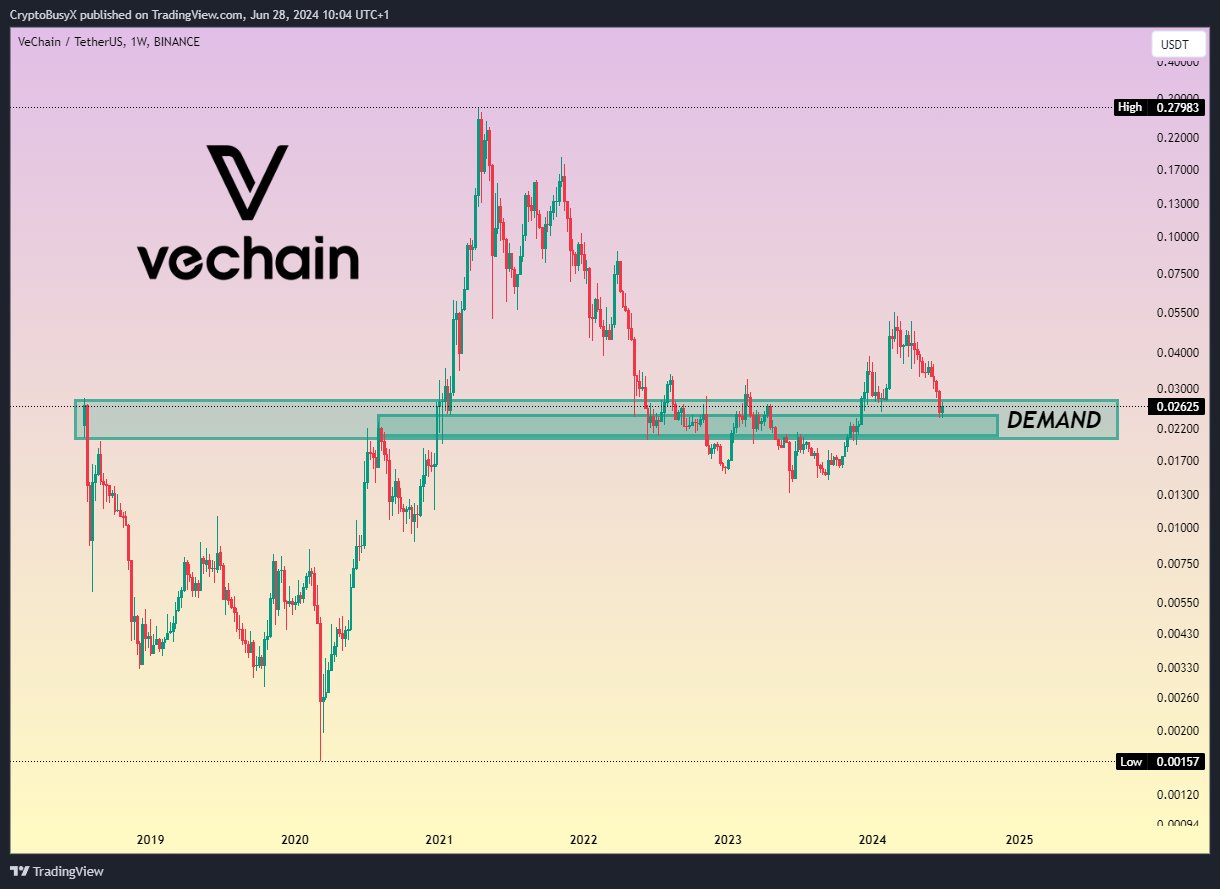
According to the analysis of one analyst – CryptoBusy – VeChain is currently in demand- A sign of a potential buying opportunity. In fact, historical data seemed to suggest that the price often finds support around $0.026, which could lead to a rebound.
VET’s price action is worth looking at, but in the context of its developments outside the price charts. For example, VeChain has made strides in the real-world asset tokenization (RWA) sector. The project focuses on supply chain solutions, while enhancing transparency and efficiency in various industries. Adopting these technologies through initiatives like VeBetterDAO aims to drive greater utility and demand for the VET token.
Trading volumes and historical price data
Analyzing VeChain’s trading volumes and historical price data revealed key trends too.
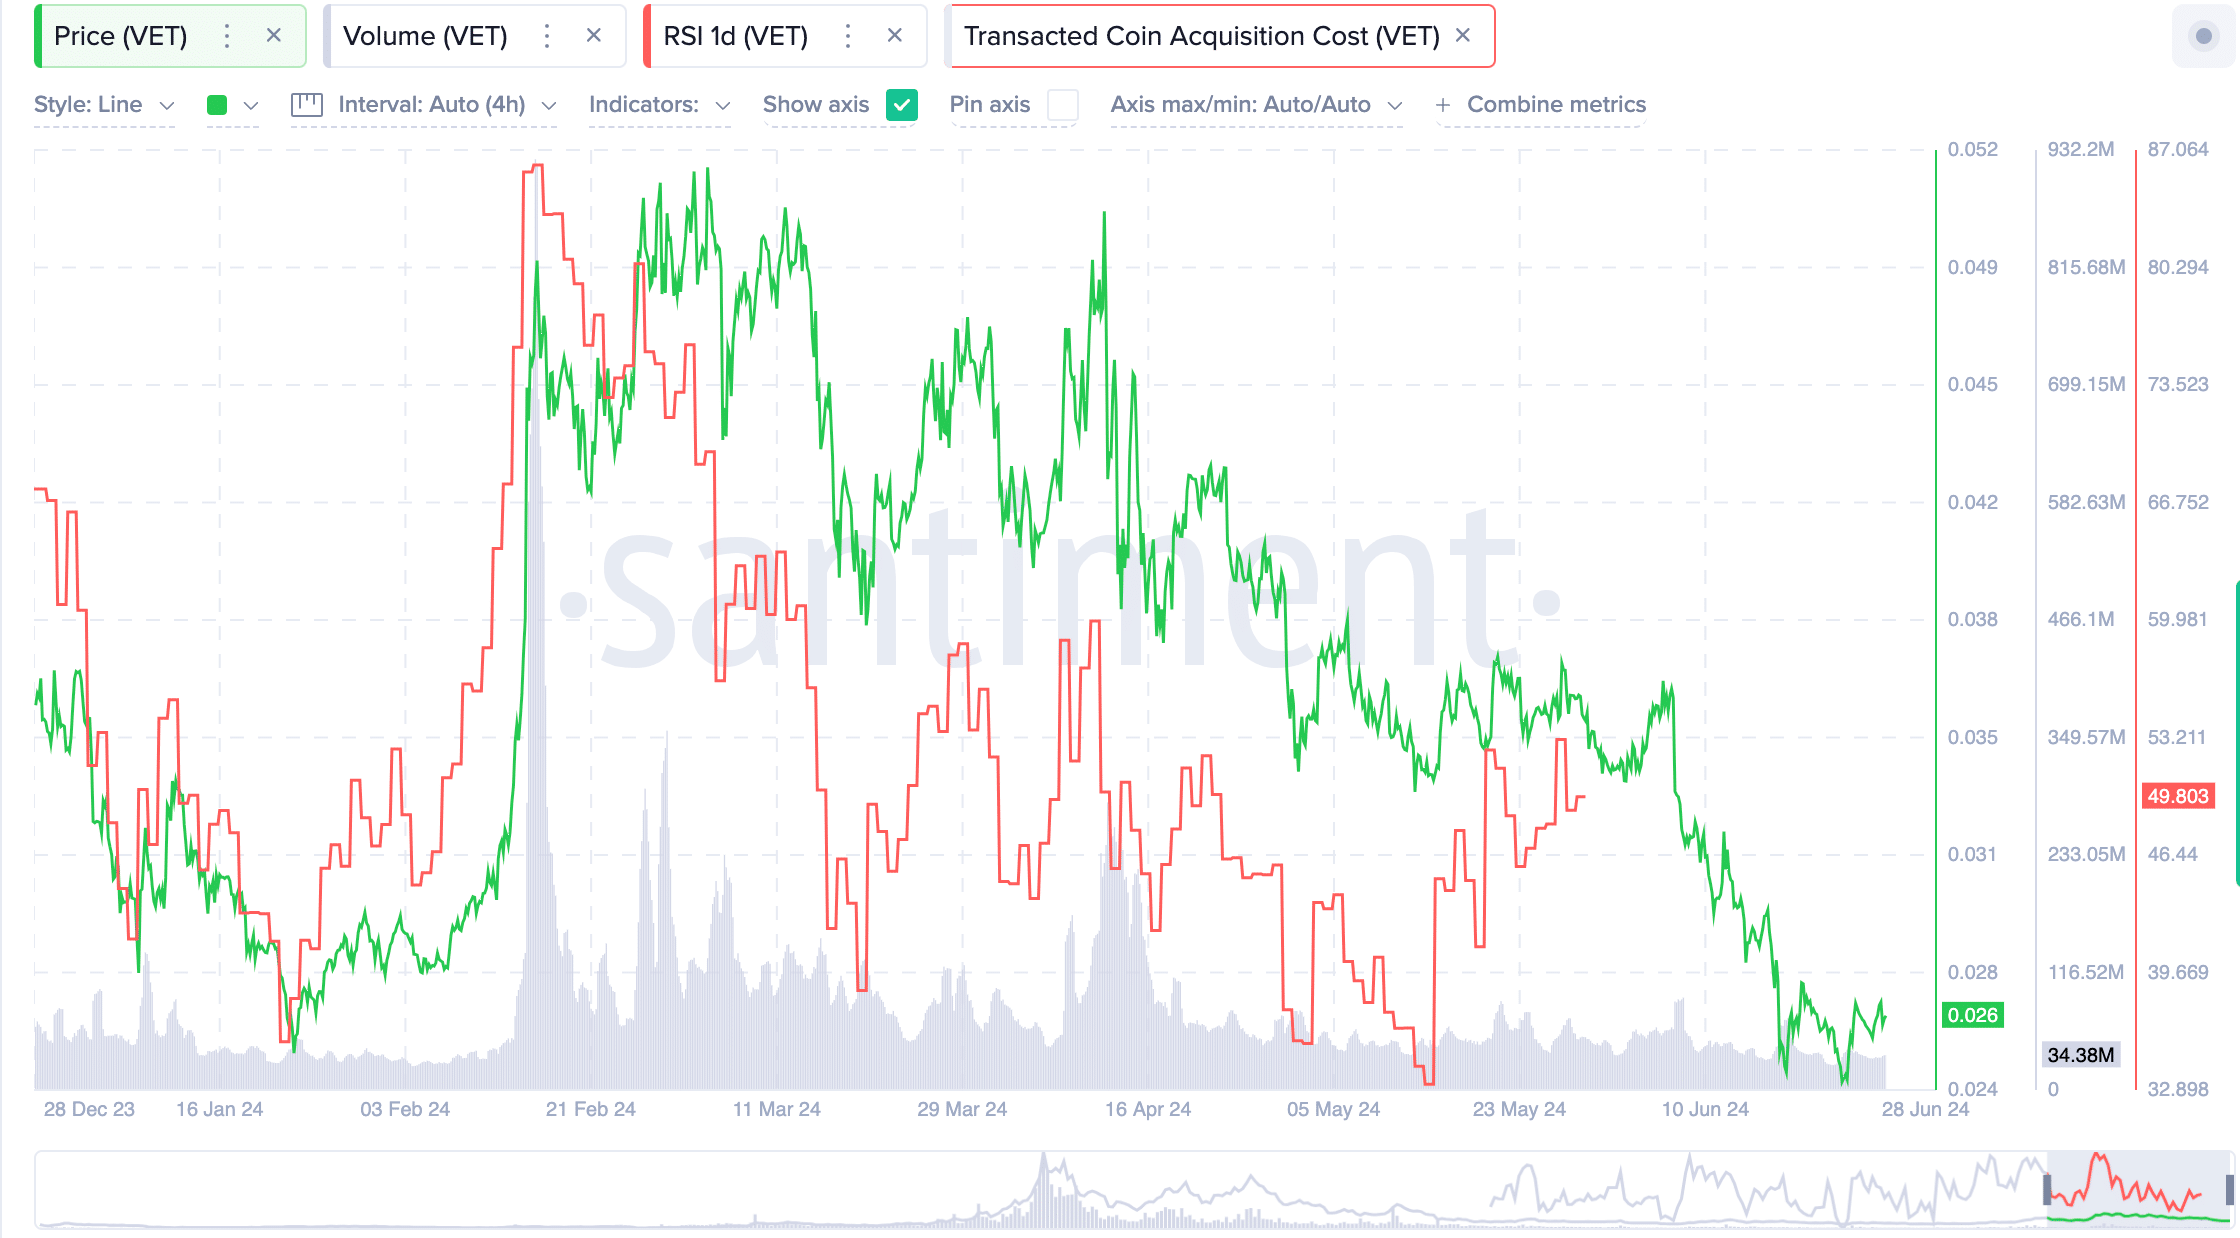
Consider this – Notable spikes in trading volume occurred in early February and mid-April, indicating periods of high market activity. Historically, VeChain’s price saw a significant surge in 2021, hitting a peak of around $0.27983 on the charts.
Source: X
However, the price declined from 2022 to 2023, followed by some consolidation within the demand zone. In 2024, another rally was observed, but the price returned to the demand zone, highlighting its critical support level.
The correlation between price and volume revealed that the price sharply appreciated in early February, suggesting a bullish, solid sentiment. Post-February, the price declined with periodic volume spikes, indicating potential sell-offs or accumulation phases.
At press time, the RSI (Relative Strength Index) was around 49.803, indicating a neutral market condition – Neither overbought nor oversold. This neutral RSI seemed to support the view that the market was balanced, providing a potentially stable entry for investors.
Source: Santiment
Here, it’s worth pointing out that the RSI’s fluctuations between the overbought and oversold levels reflected the market’s volatility. Especially since the resistance levels were noted at around $0.052 – A level the price has previously struggled to break through.